Field experience on PD measurement for MV cables using different voltage sources, DAC and sinusoidal VLF
Authors
D.C. LEE - Mondo
R. WHEATLAND - AusNet

Summary
This paper presents our field testing experiences on partial discharge (PD) measurements for MV cables. A selection of 15-25 year old 22kV, service aged cables were tested for PD using Damped AC (DAC) and sinusoidal VLF, the two most used alternative voltage sources to power frequency for field testing of MV cables. During the program, we purposefully tested for PD activity utilising the two different test voltage sources one immediately after the other to assess any discrepancies between the different tests. A total of 78 individual cable circuits, comprising 209km in core length and containing 677 joints were tested. PD activity was observed in 226 of these joints which were further analysed, and the PD inception voltages (PDIV) and PD magnitudes, the two most useful diagnostic parameters, were compared.
Some studies on DAC and sinusoidal VLF and relevant field experiences seem to indicate that 50-500Hz DAC is more representative of the 50/60Hz AC system voltage (or power frequency voltage) than 0.1Hz sinusoidal VLF, and thus more effective on PD measurement [1-2]. Our results also seem to support the findings from these studies. As an extension to this we also used both 50Hz AC and DAC on eight randomly selected cable accessories in cable circuits and obtained reasonably comparable results with a good correlation in the PDIV. Though, some significant discrepancies were observed in the PD magnitudes.
On the other hand, our experiences with DAC and sinusoidal VLF on a much larger cable group seem to suggest that there are much larger differences between the two voltages in regard to the PDIV and PD magnitude. Statistics showed that overall, up to 25% more PD events were detected using DAC than sinusoidal VLF. The differences observed in the PDIV were higher with only 30-45% of the joint PD activity being seen with both DAC and sinusoidal VLF. The remaining 55% were only seen from one voltage source, either DAC or sinusoidal VLF. Details of these statistics are presented in Table 1 in this paper.
These outcomes appear to be contrary with some other laboratory studies claiming that sinusoidal VLF is comparable with power frequency AC for PD measurement [3] and suggest that there are still some knowledge gaps. The statistics in this paper do not offer a direct comparison between power frequency AC and sinusoidal VLF.
Keywords
DAC, VLF, PD, Cable, Joint1. Introduction
The measurements of Partial Discharge (PD) activity is one of the key diagnostic methods for condition assessment of MV cables and is especially effective in identifying and localising weak components such as joints and terminations in cable systems. PD measurements seek to find defects that can lead to insulation system failures. Performance measures should be focused on how well the diagnostic process is able to identify and distinguish defects. Power Frequency (50/60Hz) AC is an ideal voltage source for PD measurement as PD activity in the cable system can be observed under the same frequency conditions that exist in service. However, mobilising a power frequency AC voltage source to the field is not always practical due to its large size and high power requirement, as a result, DAC or sinusoidal VLF voltage sources are used as an alternative.
DAC testing has two stages, the charging stage when the cables are charged with DC and the following discharging stage when the actual PD measurement is performed. During the discharging stage, the energy stored in the cable is released to the test system inductance coupled with the cable capacitance, which creates a resonate damped oscillating wave of typically 50-500Hz in the cable. As such, the voltage generation of DAC is very different from power frequency AC in nature. The CIGRE study [4] also addresses this issue and briefly discusses the space charge build-up from the long charging period as one of the factors that may affect the measurement of PD parameters such as the PDIV and PD magnitudes. Nonetheless, a major downside of DAC is that it is generally considered not suitable for HV withstand testing due to the decaying characteristic of the test voltage.
Sinusoidal VLF voltages are utilised in a wider range of applications as it can generate continuous alternating voltage suitable for withstand testing and other diagnostics testing such as PD and Tan δ (or VLF-TD) measurement. With the recent introduction of Monitored Withstand Test (MWT) combining voltage withstand, Tan δ (or VLF-TD) and PD, along with its convenience, many utility companies use sinusoidal VLF. However, when compared with power frequency AC, sinusoidal VLF can develop very different electric field distributions in accessories, and coupled with the high and non-linear conductivity of field grading materials in accessories that are frequency dependent, PD measurement using sinusoidal VLF could be quite different from the power frequency AC measurement [5].
As part of the AusNet asset management program, off-line PD measurement was chosen to capture a relatively quick snapshot of the condition of the cable circuits. The testing protocol allowed a cable circuit (cable, terminations and joints) to be tested to higher than service voltages, allowing a myriad of important parameters to be captured, as well as having different parts of the circuit tested that are not available whilst in service.
This paper was prepared with the understanding that PD activity can only be tolerated within the accessories of a cable circuit for any length of time. PD activity within the cable insulation will lead to electrical breakdown relatively quickly so the PD activity being observed and analysed is assumed to be within the accessories (Terminations and Joints). This assumption has been verified during tests on other cable circuits not being reported in this paper, where the observed PD activity was located away from the accessories and has led to the cable circuit failing during the application of the test voltage [6].
2 Review of Various Studies of PD Behaviour under Different Voltage Stresses
There have been various studies indicating that PD behaviour of insulation defects under these two voltage stresses are not identical with those under power frequency AC voltage [7-10]. An early laboratory study using a needle on a cable sample comparing DAC, sinusoidal VLF and power frequency AC to evaluate their effectiveness on PD measurement showed that there were significant differences. In the experiment, approximately 2-3 times higher voltages were required for both DAC and sinusoidal VLF to initiate PD from the needle type defect than was required at power frequency AC [7]. A more recent laboratory experiment using various types of artificial defects in joints, which simulated the common types of PD that could exist in the field, also seemed to agree with the findings to some extent as the PDIV under the two different types of voltages were consistently 1.1-1.5 times higher than those under power frequency AC [8].
Some other laboratory studies performed earlier comparing PD behaviours under different frequencies seem to have obtained contradictory results [9-10]. One of the experiments using a specimen of dielectric bonded cavities embedded in an XLPE matrix extended the test frequency to 1000Hz AC which is far beyond the DAC frequency and found that the PDIV tended to be lower as frequency decreased. This seems to imply that the PDIV under sinusoidal VLF should be lower than those under power frequency AC while DAC should have the highest PDIV [9]. Another similar experiment with artificial defects in cable joints using the test frequency from 0.1Hz to 100Hz AC also obtained the similar correlation between the PDIV and the test frequencies [10].
In 2007, using various artificial defects on joints and terminations, K. Rethmeier et. al. demonstrated that the PDIVs under sinusoidal VLF were within ±30% of those under power frequency AC [3] and claimed that sinusoidal VLF were comparable with power frequency AC for PD measurement, whereas R. Bach et. al. claimed that DAC is well comparable with power frequency AC for PD measurement by demonstrating that the PDIV under DAC were within ±5% of those under power frequency AC [1].
To add to the discussion, several extensive literature studies on this subject were performed by EPRI and two CIGRE Working Groups D1.48 and B1.38 respectively in 2013, 2018 and 2021. The EPRI report also noted the difference in the PDIV between the two voltage sources and urged that there is a lack of real field experiences on this subject [11]. It should be noted that most of the laboratory studies use quite severe defects on low number, small-scaled samples which are not representative of the real field issues. The two CIGRE reports also suggest that different types of defects coupled with the complex electrical characteristics of the field grading materials in the accessories can complicate the prediction of PD behaviour under the different voltage stresses [4-5].
There were also a few laboratory studies on PD magnitudes and their correlation to the different voltage sources. An observation from some of the studies was that decreased frequency caused a reduction of PD magnitudes [5, 12].
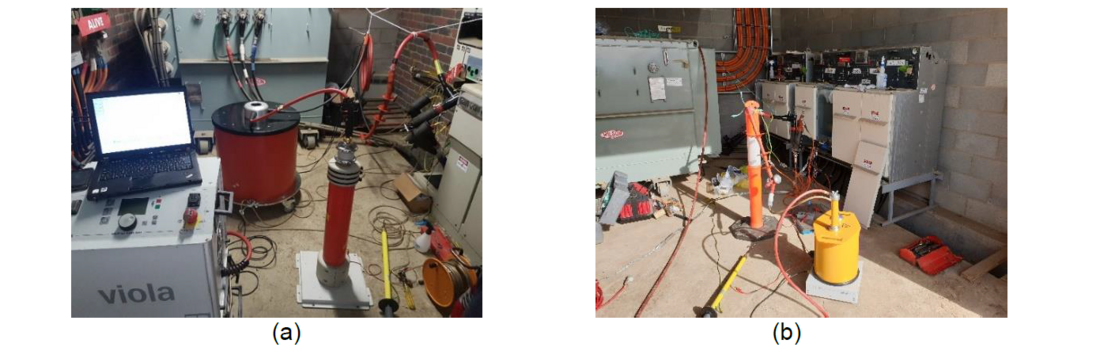
Figure 1 - (a) DAC PD measurement, and (b) Sinusoidal VLF PD measurement
To date, only a few papers are available which compare the PD measurement in the field using the different voltages on a full cable circuit length. H. Putter et. al. presented the outcomes of the PD investigation after applying these voltages to the same cables one immediately after the other and demonstrated that DAC was able to identify more PD activities than sinusoidal VLF from the same cable circuits [2].
Nonetheless, some researchers have different conclusions on this and suggested a cross-checking of PD by both voltages applied to the same cables one after the other. This is to avoid the possible misinterpretation of the results from only one voltage source and consequently, build the confidence level in their findings and lead the asset management to a better decision [6, 13-15]. This paper was written to further the understanding in this area.
3. Field Testing Program
Since 2014, more than 1,000 new or aged 22kV cable circuits throughout the AusNet network were tested for PD using power frequency AC [16].
In addition, a selected group of 15-25 years old cables from 169 individual circuits with a circuit length of 154km, or a core length of 462km, were tested using DAC for PD measurement without using power frequency AC. This was because many of the circuits in the group were in mountainous areas presenting challenges to the testing staff for access and logistics, the access to the cables with a large power frequency AC test system was not practical. Though, one observed advantage of the geographical remoteness was the very low background noise levels experienced during PD measurement. In addition, sinusoidal VLF was also engaged to conduct Tan δ (or VLF-TD) measurement.
Since 2018, sinusoidal VLF was added to the PD measurement protocol to cross-check the results from DAC and to start producing additional information. This could reduce the risk of the results being misleading from only one voltage source and increase the opportunity of detecting further deteriorated components. Consequently, a large set of data from both DAC and sinusoidal VLF has been obtained from this 5 years of test program.
3.1. Cable System
The geographical sample area consisted of several regions throughout Victoria, each being supplied via long, radial feed, 22kV XLPE, mainly of 185 mm2, aluminium conductor, 3 core cables connected to substations, which on average were approximately 30km away from the region. The cable system design within the selected regions consisted of several ring main circuits and a multitude of radial feeders.
Typically, the cables have been installed utilising a plough-in technique, with joints installed for the longer circuits in an area surrounded by concrete walls and then backfilled with excavated soil, as shown in Figure 2(a). For shorter length circuits, the joints were direct buried as shown in Figure 2(b).

Figure 2 - (a) Direct buried joint, (b) Long circuit joint bay area, and (c) 3-way connection cubicle
The cable terminations are typically insulated elbow type connectors connecting directly onto either switchgear or transformers or above ground connection cubicles used as an alternative to underground joints. These cubicles can be 2-way, 3-way or in some circumstances 4-way connection points. Figure 2(c) shows a 3 -way above ground cubicle.
3.2. DAC vs Power Frequency AC
During an early stage of the test program, some of the cable accessories which showed PD under power frequency AC were tested again with DAC. This was primarily to calibrate the PD test equipment against each other but at the same time to check the compatibility of DAC PD measurement to the power frequency AC measurement. A total of 6 cable circuits, incorporating terminations and joints were randomly selected. The selected accessories were purposefully tested for PD activity utilising both power frequency AC and DAC one immediately after the other to assess any discrepancies between the different tests. This was only undertaken on a sample of circuits as the process took more time than usual and could not be implemented for the entire population of cable circuits. Figure 3 shows the results of the PD measurements conducted on the selected accessories.
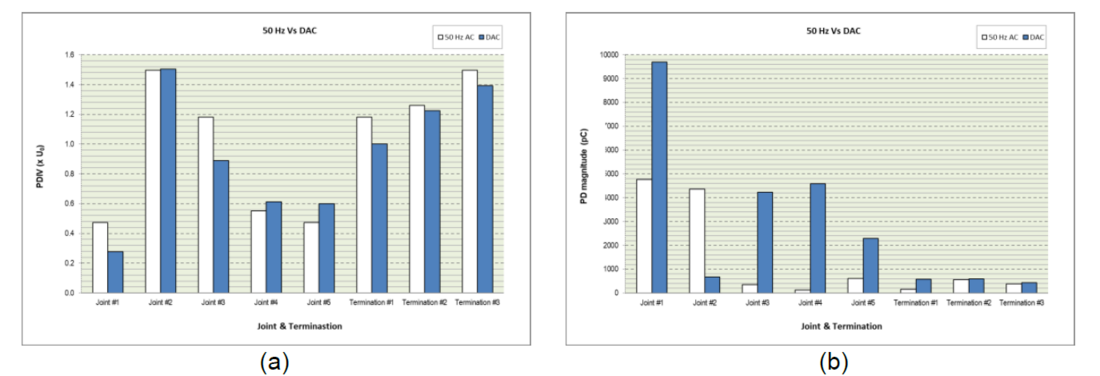
Figure 3 - (a) The PDIV under power frequency AC vs DAC, and (b) PD magnitude at 1.6xU0 under power frequency AC vs DAC
DAC voltage used in this paper are rms value (Vpeak /√2). PD magnitudes for power frequency AC in the graph were the largest repeatedly occurring PD magnitudes as defined in IEC 60270 [17] whereas those for DAC were the highest magnitude recorded on the instrument. PD repetition rates and intensity were not considered for DAC in making of these graphs as such information could not be easily extracted from the software used for the DAC measurements. White and Blue colours in the graphs represent power frequency AC and DAC respectively.
Figure 3(a) shows that the PDIV were similar for both power frequency AC and DAC and the standard deviation of the PDIV for all 8 accessories was only 0.13xU0. As such, DAC appeared to be quite compatible to power frequency AC for the PDIV measurement. However, significant discrepancies were observed in PD magnitudes between the voltages with the deviations being in an order of magnitude for some accessories. Though, none of these two voltages consistently produced higher magnitudes of PD than the other.
3.3. DAC vs Sinusoidal VLF
For a total of 78 individual cable circuits, comprising 209km in core length, DAC and sinusoidal VLF were applied one immediately after the other for PD measurement. Each voltage was slowly raised to their respective maximum test voltage levels with an increment of 0.1xU0 and PD measurements were performed at each voltage level. At each voltage step, approximately 5-10 shots of DAC voltages were applied whereas approximately 100-200 individual PD signals were recorded during sinusoidal VLF measurement.
The voltage levels used for the PD measurement were carefully selected so that they did not overstress the cables yet are still able to identify weak components in the cable circuits, allowing any repairs to be undertaken in a timely manner. Considering the criticality of the cables and the availability of work crews, unprepared cable failures during or after the test program needed to be minimised. In consideration of ageing status of the cables, the optimal test voltages were agreed at 1.3xU0 rms value for DAC and 1.6xU0 rms value for sinusoidal VLF [6].
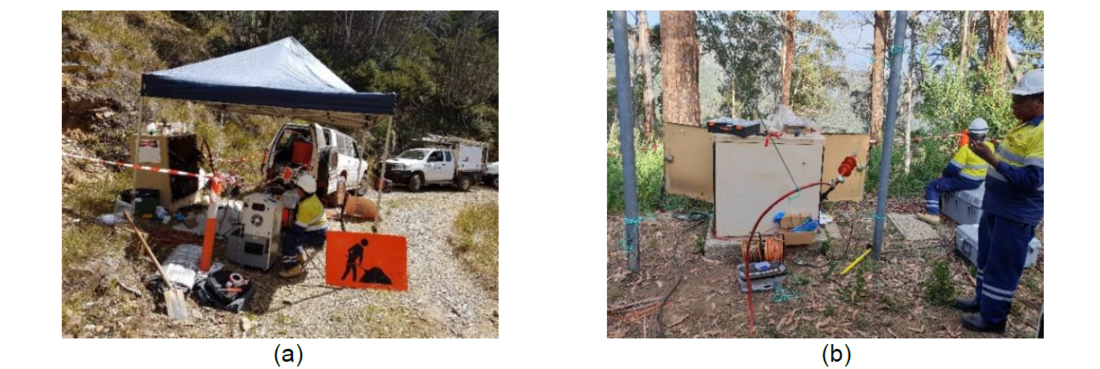
Figure 4 - (a) Test set-up in mountainous area on a 4WD track [6] and (b) Cable junction box in a forested area
The PDIVs are recorded as are the PD magnitudes at each voltage level. The test results and their statistics are presented and discussed in section 4 of this paper.
4. Results and Statistics
PD activity was observed in 226 joints out of the total 677 selected joints using one of the two voltage sources being reported, which was 33.4% of all tested joints. This alarmingly high rate of defect detection may simply be the result of good timing, commencing the condition assessment tests when the deterioration of the joints had progressed to a point that enabled detection of the worst activity and to proactively set about to replace them. Whatever the reason, the results gave an opportunity to collate well supported statistics and build a foundation for the on-going MV cable maintenance programs.
For the statistics in this paper, only the PD activity from joints have been used as their construction type and therefore internal materials are nearly consistent over the sampled population. Being a Slip-on-Joint, they would have been installed using a consistent, typical methodology allowing them to share common field issues. The other reason to have only used the PD results from joints, and not terminations, for this statistical comparison of the two voltage sources was that cable terminations are more susceptible to interference noise or discharges from either the measurement setup or the switchgear to which they are in close proximity. Such electrical ’noise’ can often be misinterpreted to be PD activity within the terminations due to a limitation of the PD localisation based on TDR technology [18].
4.1. Overview
The number of joints where PD activity was detected were categorised by the voltage type and the voltage level and tabulated accordingly in Table 1 to provide an overview.
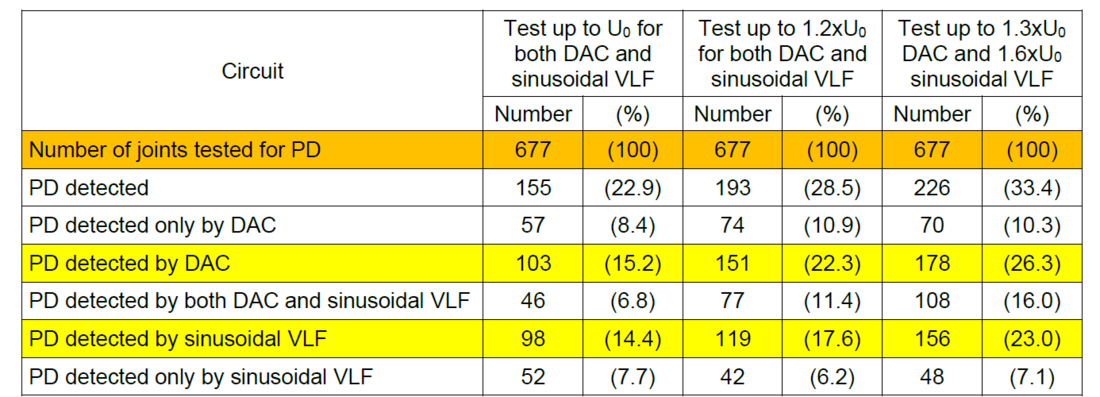
Table 1 - Number of joints where PD activity is detected by different voltage sources at different voltage levels
Figure 5 further visualizes these statistics with the use of pie-charts. Each voltage group shows the ratios between the 4 groups of joints in that, no PD observed, PD observed only by DAC, PD observed only by sinusoidal VLF and PD observed by both DAC and sinusoidal VLF. It appears that overall, slightly more numbers of PD activity were detected by DAC than by sinusoidal VLF, but none of the voltages appears to be dominant in all voltage levels. The table also shows that using only one type of voltage source cannot ensure the detection of all existing PD activity in joints. This indicates that PD in some of the joints could behave quite differently under different voltages yielding different PDIV.
A solution which may help to detect a greater number of PD events could be the application of higher test voltages using one of the voltage sources. This could initiate more PD activity that exist below the PDIV, but it can also increase the risk of the cables failing during test as it may cause the cable to breakdown at some other weak spots. The object of this testing program was to assess the condition of the cable circuits and not to introduce unwanted network failures.

Figure 5 - (a) Number of joint where PD activity was detected (a) up to U0, (b) up to 1.2xU0, and (c) up to 1.3xU0 DAC & 1.6xU0 sinusoidal VLF. Blue – PD activity was detected only by DAC, Red – PD activity was detected only by sinusoidal VLF, and Green – PD activity was detected by both DAC and sinusoidal VLF
Nonetheless, Figure 5 demonstrates that even though the voltages increased to 1.3xU0 for DAC or 1.6xU0 for sinusoidal VLF, there was always a certain ratio of joints where PD activity is detected by only one voltage source. This can lead to a question on whether there is any correlation between the PDIV of the two voltages, as if there exists such a correlation, the test program could be adjusted accordingly to optimise and increase the chance of detecting more PD events.
4.2. Analysis of Correlation between PDIV at DAC and Sinusoidal VLF
The correlation of the PDIV between the two voltages were further investigated using the 226 joints where PD activity was detected. Figure 6 visualizes the correlation between the PDIV of the two voltages. Figure 6(a) shows the PDIV at sinusoidal VLF in respect with those at DAC while Figure 6(b) shows them in the opposite way.
As shown in both graphs, the two groups of PDIV do not have any recognisable correlations between them. At the perspective of the PDIV of one voltage source, the other group of PDIV appeared to be scattered randomly over the squares. This may suggest that the discrepancies of PD behaviour between the two voltages are much greater than anticipated as per the previous studies [7-12]. No meaningful correlations could be derived from these statistics due to their randomness.

Figure 6 - (a) The PDIV at sinusoidal VLF in respect with those at DAC, and (b) The PDIV at DAC in respect with those at sinusoidal VLF
Each graph in Figure 6 has 226 dots of each colour representing the individual joints where PD activity was detected. Blue and Red dots represent DAC and sinusoidal VLF respectively. Both graphs show a group of Red dots concentrated and created a horizontal line at U0. The reason of a Red line formed at U0 was that some of the PD measurements using sinusoidal VLF started from U0 toward 1.6xU0 due to time limit in the field. Sometimes, there was time pressure in the field as cables had to be returned to service in time. On such occasion, even though the PDIV was below U0 for sinusoidal VLF, it was recorded as U0. As a result, some of the PDIV at U0 in Red could actually be lower.
4.3. Analysis of Correlation between PD Magnitudes at DAC and Sinusoidal VLF
Finally, the correlation between the PD magnitudes of the two voltages were investigated. PD magnitudes are subject to attenuation when the measurement is performed on considerably long cables. Nonetheless, such attenuation has little influence on the correlation as PD originating from the same joint must undergo the same attenuation before arriving at the detectors. As such, attenuation of the PD signals and the cable circuit length were not considered when drawing the following correlation graphs in Figure 7 and 8.

Figure 7 - (a) Correlation of the PD magnitudes in linear scale, 574 dots plotted, and (b) The same correlation in logarithmic scale, 231 dots plotted
Figure 7(a) shows the correlation of all 574 individual PD events detected at any of the three voltage levels in linear scale, which are U0 and 1.2xU0 respectively for both DAC and sinusoidal VLF, and 1.3xU0 for DAC and 1.6xU0 for sinusoidal VLF. Each dot represents a single PD event from any joint at any of the three voltage levels, and its location in respect with the two axis shows the correlation of the PD magnitudes between the two different voltages. Many dots (343 out of 574) are located on the two axis lines indicating that they were detected by only one voltage source. Also, most of the PD activities were observed to be less than 2,000 pC and found only at the left bottom of the square. As such, it is hard to find any correlation between the two voltages from this linear scale.
Figure 7(b) in logarithmic scale can reveal more insight of the distribution pattern of the PD magnitudes. The graph shows all the PD events (231 out of 574) observed by both DAC and sinusoidal VLF at any of the three voltage levels. The graph also shows a cloud spread along the diagonal line which could be seen as a loose correlation between the two groups of PD magnitudes. Overall, sinusoidal VLF tends to produce slightly higher PD magnitudes than DAC by approximately 50% on average at the same voltage levels. However, the deviations vary from an order of -2 to 2 and as such, the results do not seem to well agree with some of the laboratory studies [12]. Nonetheless, in the field, the cloud could appear as a simple randomness making the PD magnitudes unpredictable and as such, there would be no real implication of such findings.

Figure 8 - (a) (b) Correlation of the PD magnitudes at each voltage level at U0 and 1.2xU0 respectively (c) The PD magnitudes were compared at the maximum test voltages of 1.3xU0 DAC and 1.6xU0 sinusoidal VLF
The Figure 7(b) graph can be divided into three separate graphs according to the voltage levels as shown in Figure 8 to gain more insight of the correlations. They show that the PD magnitudes increase slightly with an increase of the voltages, but their distribution patterns appeared to be similar over all voltage levels.
4.4. Some Considerations
Considering that most laboratory investigations are conducted in a controlled environment such that their background noises were as low as 2pC [8] and the specimen or the cable sample used for the investigations were as short as 1.2m [1, 3, 8-10, 12], some degrees of discrepancies should be expected between the laboratory outcomes and the field findings.
To make these statistics less complicated, some of the factors affecting the sensitivity of the PD measurement were also neglected. One of the factors is the different noise or electrical interference level present in each testing site and with the different voltage sources. In our field testing experiences, the background noise levels were usually 20-100pC for DAC and 70-200pC for sinusoidal VLF. Usually, PD measurements using sinusoidal VLF were affected by slightly higher background noises which was most likely due to the nature of the voltage source as also noted in the CIGRE study [4].
One other consideration was the varying frequency of DAC determined by the cable length under test. A study by F. J. Wester in 2015 also showed that such varying frequency could affect the PDIV and PD magnitudes [19]. During the test program, PD measurements using DAC were performed in the frequency range of 143-444Hz for the cable length of 100m-6km. The influence of the DAC frequency to the measurement sensitivity was also not investigated in this paper as it may introduce further complications to the statistics.
Finally, it should be noted that the cable lengths under test can also affect the sensitivity of the PD measurements due to attenuation of PD signals. For the same reason, such reduction of the measurement sensitivity was also not reflected in the building of these statistics.
Nonetheless, one of the key aspects in the field testing is the ability to accurately locate PD events if PD activity is detected. Our field experiences found that there was no discrepancy between the two voltage sources in localising PD activity because the PD propagation is independent of voltage source type as also noted in the CIGRE study [4].
5. Conclusion and Discussion
This paper presented some of the findings from a 22kV cable testing program that incorporated a series of off-line tests undertaken on a sample area of the Medium Voltage (MV) cable network in Victoria, Australia. As per the program, any accessories that showed higher than 10,000pC coupled with low PDIV have been replaced [6]. The program also experienced a few failures of the cable circuits during the application of the voltages. The failed cable sections or accessories were replaced subsequently. It was observed that the breakdown occurred mostly during Tan δ (or VLF-TD) measurement where simultaneous PD monitoring was not used.
Among these cables, a total of 78 cable circuits of 209km core length and containing 677 joints were tested using both DAC and sinusoidal VLF on the same circuits, and among the 677 joints, 226 joints showed PD activity. This was probably the first large collection of field-based data which can compare the two voltage sources directly in regard to PD measurement.
The statistics seem to indicate that there are considerable differences between the two voltages when they are used for PD measurement. Overall, DAC detected slightly more PD than sinusoidal VLF but neither seemed to be clearly superior to the other. Further trials to understand the correlations between the two voltages in regard to the PDIV and PD magnitudes were not successful due to the large deviations between them.
The outcomes may suggest the following,
- Laboratory investigations may not be fully representative of what is found in actual field testing,
- Each defect may behave differently under different voltage stresses affecting the PDIV and PD magnitudes,
- To understand the different voltage sources in regard to PD measurement, more studies and field experiences need to be gained.
As demonstrated in section 3.2, in a small-scale field investigation on 8 randomly selected cable accessories, DAC generated relatively compatible results with power frequency AC on PD measurement. On the other hand, sinusoidal VLF could be more convenient to use due to its ability to provide continuous voltages for withstand testing and Tan δ (or VLF-TD) coupled with PD measurement. Therefore, the authors suggest the use of DAC for PD measurement in conjunction with sinusoidal VLF as the voltage source for MWT (Monitored Withstand Test) coupled with Tan δ (or VLF-TD) and PD measurement. This would maximise the opportunity to identify any field issues until we can gain more understanding on these two voltage sources.
To conclude, a robust asset management (AM) program, with the correct testing protocols (voltage levels and pass/fail criteria) is an essential part of maintaining a reliable MV cable network. As with all AM strategies, the outcomes are only as strong as the data on which they are built, so accurate, repeatable field testing techniques are the vital source of this data. The AM Decision Support System (DSS) can then be established to ensure timely and economic solutions are implemented.
References
- R. Bach, D. Muller, and C. Walter, “Comparative Investigations of PD-Behaviour on an Artificial Accessory Failure under medium Voltage AC and Damped AC (DAC)”, Jicable’19, 10th International Conference on Insulated Power Cables – Versailles 23-27 June, C1-3, 2019.
- H. Putter, F. Petzold, and P, Legler, “Offline PD Diagnostics Using Several Excitation Voltages”, CIRED, 24th International Conference on Electricity Distribution, Glasgow, 12-15 June, Paper 0049, 2017.
- K. Rethmeier, P. Mohaupt, V. Bergmann, W. Kalkner, and G. Voigt, “New studies on PD measurements on mv cable systems at 50Hz and sinusoidal 0.1Hz (VLF) test voltage”, 19th International Conference on Electricity Distribution, Vienna, AT, pp. 21-24, 2007.
- Working Group B1.38 CIGRE “After Laying tests on AC and DC cable systems with new technologies”, Technical Brochure 841, September 2021, 74 pages.
- Working Group D1.48 CIGRE “Electrical properties of insulating materials under VLF voltage”, Technical Brochure 751, December 2018, 43 pages.
- R. Wheatland, and D. C. Lee, “Condition Assessment of Aged Medium Voltage Cables”, Jicable’19, 10th International Conference on Insulated Power Cables – Versailles 23-27 June, D9-1, 2019.
- R. Bach et. al., “Voltage tests to assess medium-voltage cable systems”, Elektrizitaetswirtschaft, Jg. 92, Heft 17/18, pp. 1076–1080, 1993.
- A. N. Jahromi, P. K. Pattabi, S. Lo, and J. Densley, “Comparison of Different Voltage Waveforms for Partial Discharge Measurement in Medium Voltage Cables and Accessories”, 2022 Electrical Insulation Conference (EIC), Knoxville, TN, USA, 19-23 June, 2022.
- A. Cavallini, V. Krotov, G. C. Montanari, P. H. F. Morshuis, and L. E. Mariut, “The role of supply frequency in the evaluation of partial discharge inception voltage in XLPE-embedded cavities”, 2012 Annual Report Conference on Electrical and Dielectric Phenomena, pp. 487-490, 2012.
- F. Mauseth, H. Tollefsen, and S. Hvidsten, “Effect of Test Voltage Frequency on PD Inception in Service Aged Cable Joints”, 2014 ICHVE International Conference on High Voltage Engineering and Application, 08-11 September, 2014.
- EPRI Report 3002000867, “Insulation Breakdown and Partial Discharge Behaviour Under Continuous Voltage Very Low Frequency (VLF), Near Power Frequency AC, and Damped AC Voltage Sources: Literature Study”, December 2013.
- X. Feng et. al., “Cable Commissioning and Diagnostic Tests: The Effect of Voltage Supply Frequency on Partial Discharge Behavior”, ICPADM, 12th IEEE International Conference on the Properties and Applications of Dielectric Materials, 20-24 May, 2018.
- P. Buys, and D. Van Houwelingen, “Effectiveness and comparability of condition tests on MV cables”, Jicable’15, 9th International Conference on Insulated Power Cables – Versailles 21-25 June, D2.6, 2015.
- B. Oyegoke, P. Hyvonen, M. Aro, and N. Gao, “Selectivity of Damped ac (DAC) and VLF Voltages in After-laying Tests of Extruded MV Cable Systems”, IEEE Transactions on Dielectrics and Electrical Insulation, Vol 10, Issue: 5, pp 874-882, 14 October 2003.
- M. G. Niasar, X, Wang, and R. C. Kiiza, “Review of Partial Discharge Activity Considering Very-Low Frequency and Damped Applied Voltage”, Energies 2021, 14, 440, January, 2021.
- D. C. Lee, “Cable Testing Enhances Reliability of Power Network”, Utility Magazine Issue #11, August, Australia, pp. 96-99, 2016.
- IEC 60270, “High-voltage test techniques – Partial discharge measurements”, Third edition, 2000-12.
- F. De Vries, J. Smit, and J. Van Slogteren, “Results of 10 years after installation tests combined with PD detection on MV cable systems”, Jicable’15, 9th International Conference on Insulated Power Cables – Versailles 21-25 June, D1.4, 2015.
- F. J. Wester, “Condition Assessment of Power Cables using Partial Discharge Diagnosis at Damped AC Voltages”, Thesis, ISBN 90-8559-019-1, December, 2015.