A2 - Analysis of non-accelerated thermal aging of model windings immersed in mineral oil and natural ester
Authors
Diego ROBALINO - Megger, USA
Matias MEIRA - Intelymec (UNCPBA), Argentina
Raúl ALVAREZ - IITREE-FI-UNLP, Argentina
Fabio SCATIGGIO - A&A Fratelli Parodi SpA, Italy

Summary
This paper presents a unique set of experimental results from tan , Dielectric Frequency Response (DFR) and Degree of Polymerization (DP) tests carried out at different stages on four paper-liquid insulation models of identical geometry. Each model consists of a scaled dielectric system built with copper windings wrapped in kraft paper and immersed in mineral oil (two models M1 and M2) and in a soybean-based natural ester (two models E1 and E2), respectively, mounted inside sealed containers of 3.6 liter. Each model is subjected to an average paper temperature of 77 °C by continuously inducing an AC signal to the four experimental models connected in series for a period exceeding 5 years.
A DFR test of the insulation is performed on each model at different stages of the non-accelerated thermal aging process to evaluate the moisture content in the cellulose and the insulating liquid conductivity. The behavior of the complex capacitance is also analyzed. In the experimental work, the sensitivity of DFR is verified to confirm the thermal degradation of insulation materials composed of mineral oils and natural esters.
In addition to evaluating the changes in the dielectric response of each model using DFR, the analysis is conducted on the effects of aging and thermal degradation on each of the models, by sampling and analyzing the Degree of Polymerization (DP) value of paper insulation. For this purpose, it is considered the DP value of the paper in the initial state (before aging), after 10000 h of aging, and after 44640 h.
This study on DFR tests, comparing mineral oil and soybean-based natural ester insulation models over 5 years of non-accelerated aging, reveals a set of lessons learned and recommendations for future experimental work. It is also observed that natural esters exhibit better cellulose preservation against hydrolysis. DFR analysis in tan δ and capacitance shows important variability of moisture concentration in the paper insulation to be discussed hereinafter.
The conductivity of the liquid insulation (mineral oil and natural esters) is also analyzed as a function of percentage tan or dissipation factor changes (%DF). A significant change of %DF is observed in the models filled with natural ester at the end of the experimental process (44640 h). These findings suggest natural esters' advantages in cellulose preservation and aging resistance. Future research should validate these results and explore diverse solid and liquid insulation types for broader applicability in the transformer industry.
Keywords
Degree of Polymerization, Dielectric Frequency Response, Insulation Transformers, Mineral Oil, Moisture, Natural Ester, Liquid Conductivity, Paper, Thermal Aging1. Introduction
Historically, mineral oils have been used in most power transformers. However, in recent years, there has been a growing adoption of vegetable liquid, also known as natural esters. These types of insulating liquid are environmentally sustainable, biodegradable, and exhibit significantly higher flash and fire points than mineral oils, along with enhanced thermal conductivity. Nevertheless, these insulating liquid are still in the testing phase, even if advanced [1] for power and high-voltage transformers, as there is not enough knowledge regarding their long-term behavior. Accelerated aging tests on transformer prototypes using natural esters indicate that their lifespan may surpass that of those immersed in mineral oil [2] [4]. Earlier studies have suggested that impregnating cellulose with esters could result in more than a tenfold increase in lifetime, as the esters contribute to drying out the cellulose. However, these predictions are primarily based on experiments conducted using models with unrealistically high temperatures [3].
To analyze the level of degradation of insulating liquid, various testing techniques are employed. The most common are the measurements of acidity, oxidation stability, viscosity increase, color index, and dielectric strength. These tests have been widely used for a long time in mineral oils [IEC 60422] and are also applicable, with some small modifications, to natural esters [IEC 62975].
The solid insulation (cellulose), which is the essential part of the insulation system in power transformers, can be assessed throughout the transformer’s service life. Specific mechanical tests such as tensile strength or more commonly using correlation with chemical tests estimating the degree of polymerization (DP), moisture content, Furanic compounds, and alcohols, among others, are carried out to assess the condition of solid insulation. The DP value (measured or estimated) is the most widely used parameter to assess the aging status of the cellulose insulation of electrical equipment [3]. However, a small paper sample needs to be extracted from inside the transformer making it an intrusive and destructive test to be performed. To remove the sample for DP testing, the transformer must be removed from service, and properly isolated from the system and eventually, the active part may be removed from the tank. A costly and time-consuming process.
Historically, the moisture content in the paper had to be inferred from the measurement of moisture in insulating liquid or gas. For the last five years, a dedicated IEEE working group has been working to develop a guide comparing the different methods to determine moisture in paper. Publication of this guide will be a significant step forward to understand the variability in the response based on the method of assessment (not yet published C57.162). In the field, estimation of moisture in paper from moisture in insulating liquid is commonly used considering the water absorption characteristics of both the insulating liquid and the paper. This method has its limitations in using equilibrium curves, and the migration characteristics of water under varying temperature conditions must be considered [5].
Currently, advanced diagnostic tools are available to determine the moisture content in cellulose. One of these tools is the Dielectric Frequency Response (DFR) also known as Frequency Domain Spectroscopy (FDS). This technique is a non-invasive and non-destructive offline test specifically developed to determine the moisture content of the transformer’s solid insulation and the conductivity of the liquid insulation [6].
Considering the aforementioned particularities of DP and DFR, the performance of two physical dielectric models - one utilizing mineral oil and the other one employing soybean-based natural ester - has been assessed under identical thermal stress conditions. The significant contribution of this work lies in the development and study of two models subjected to non-accelerated thermal aging of five (5) years, seeking to represent conditions similar to those of the actual operation of a dielectric system.
2. Accelerated VS non-accelerated aging experiments
In general terms, experimental dielectric models for assessing the behavior of dielectric materials with temperature can be broadly classified into two categories: “accelerated aging” and “non-accelerated aging” [7].
The main characteristics of these processes are:
Accelerated aging:
- Intensive temperature conditions and other stress factors are applied at a higher level than the actual conditions to which the dielectric would be exposed during its normal operational lifespan.
- The purpose is to simulate and accelerate the effects of aging over time within a short period.
- It is useful for obtaining data on the lifespan and degradation of dielectrics within a shorter timeframe, facilitating the assessment and comparison of different materials or systems in a limited time.
Non-accelerated aging:
- The temperature and stress conditions are similar to those the dielectric would experience under normal or moderate usage throughout its lifespan.
- Changes in the dielectrics occur at a rate closer to what would be expected under real operational conditions.
- This provides a more accurate assessment of how materials degrade over time in practical, long-term situations.
Both approaches are useful in different contexts, depending on the specific objectives of the research or dielectric material assessment. However, special care must be taken to ensure that any accelerated test accurately reproduces real service conditions. For instance, three scenarios can be presented where accelerated processes may not be suitable [3]:
- Liquid insulation in poor condition and increased water solubility may dry out cellulose beyond normal levels at high temperatures. Therefore, poor liquid insulation condition reduces the effect of hydrolysis and may lead to inaccurate conclusions.
- When employing accelerated aging tests to evaluate the behavior of different cellulose types in mineral oil and given the similarity in the partitioning of cellulose and insulating liquid, this approach becomes apt for ranking one paper against another at elevated temperatures. This suitability arises from the consistent acceleration factor resulting from alterations in water partitioning. However, if applied to another system with significantly different water partitioning, the acceleration factors due to increasing temperatures will vary considerably.
- Only in a limited temperature range (100-200 °C) the activation energy of cellulose degradation is independent of the reaction condition: thermal (pyrolysis), oxidative, and hydrolytic degradation [7].
3. Application of DFR tests
One of the most widely-used routine tests to determine the transformer insulation system's condition is the measurement of capacitance and dielectric losses (tan δ) at power frequency (50 or 60 Hz) applying a sinusoidal signal to the test object. A low tan δ value in the measurement may be (although not necessarily) an indicator of a good insulation system condition. A high tan δ value is a warning sign regarding the insulation system's condition. However, in this latter case, it is not possible to determine whether this “poor condition” is due to the presence of contaminants, moisture, or degradation of the insulation system. To properly characterize the root of this poor condition, capacitance and tan δ measurements at different frequencies can be performed. In this way, it is possible to distinguish between resistive losses due to insulating liquid conductivity and dielectric losses originating in the paper polarization process. This is the main benefit of using DFR [6] [8].
Typically, DFR is carried out in the frequency range from 1 mHz to 1 kHz, with the measurement range depending on the physical and thermal conditions of the insulation system. The DFR test will provide a unique dielectric signature of the insulation system characterized by Capacitance (C), tan (%DF), and/or the complex permittivity as a function of frequency
where is the real part of the complex permittivity, and represents the real capacitance of the dielectric material; and
is the imaginary part of the complex permittivity, and represents the losses in the dielectric material, being
the relative permittivity of the material,
the DC conductivity,
and
are the real and imaginary parts of the complex dielectric susceptibility. From here, tan δ is defined as:
This information along with a database and employing a geometrical (XY model) and temperature-dependent mathematical model, enables an accurate estimation of the moisture content in the solid insulation (in %) and the conductivity of the liquid insulation (in S/m) [6]. The result of the liquid can also be expressed in terms of the dissipation factor, or tan δ, as preferred in this work.
4. Proposed physical models
For the experimental tests, dielectric systems were designed and scaled, consisting of copper windings insulated with insulating liquid-impregnated paper inside a vessel. Each winding has two layers of 5 turns, concentric on a transformer board T IV (IEC 60763-3-1:2010, type B.3.1A.2) cylinder. The windings are 15 x 2.5 mm cross-section and insulated by a double layer of Kraft paper.
Stainless steel vessels with a 3.6-liter capacity were employed as the containment material. The vessel lids were constructed using 10 mm thick lids Teflon, and gaskets were incorporated to ensure a sealed environment, preventing these models from contacting external air. Mineral insulating liquid and soybean-based natural ester were utilized as received, without further processing. To account for possible dispersions due to factors external to the research, two identical models were assembled with each type of insulating liquid (mineral and natural ester).
Before the impregnation process of each model, the windings were subjected to thermal drying in an oven at 75 °C for 12 h.
Figure 1 shows a schematic diagram of the setup for the physical models. To impose the same thermal stress on each model, a current of 160 A (equivalent to a current density of 4.27 A/mm2) was applied across the four cells connected in series (Figure 2).
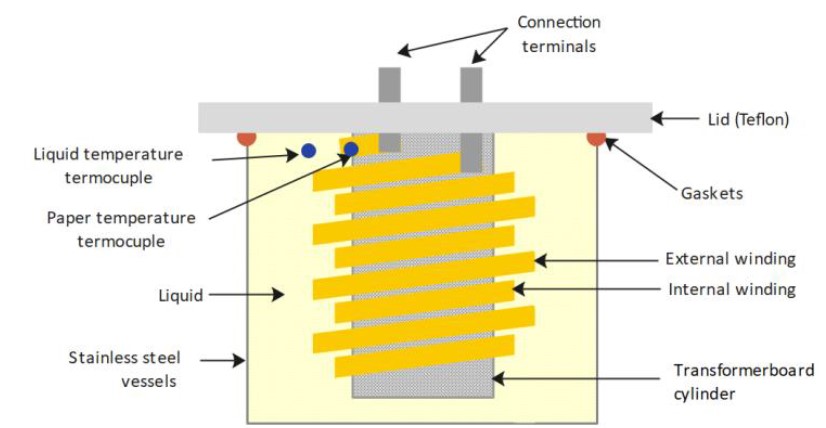
Figure 1 - Model internal setup
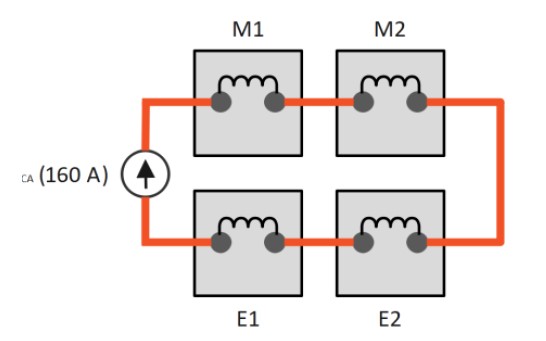
Figure 2 - Cell connection for thermal stress (E1/E2: Natural ester, M1/M2: Mineral insulating liquid)
In each model, thermocouples were installed, one to measure the temperature of the paper in one of the upper cinsulating liquids and another to measure the temperature of the “top insulating liquid”.

4.1. Non-accelerated aging stages
The normal aging test in the four cells was conducted over a period of 44640 h (5.1 years). The sequence of tasks performed for aging comparison was:
- Preparation of two models with mineral insulating liquid and two with natural ester.
- Paper sampling to determine the initial DP value.
- DFR test was conducted in each cell.
- Injection of the solicitation current continuously.
- Temperature monitoring in each cell to prevent the formation of hotspots. Paper average temperature measured at the location shown in Figure 1: 77 °C.
- The current was interrupted at 4 intervals, and after achieving thermal stabilization, a DFR test was conducted in each cell.
- Cellulose samples were taken at the first 10000 h for the determination of the DP value.
- At 44640 h, the aging process is concluded, a DFR test is conducted, and paper samples are taken for the final determination of DP value in the cellulose.
Figure 3 shows the setup of the physical models during non-accelerated aging, and Figure 4 shows one during the DFR measurements.
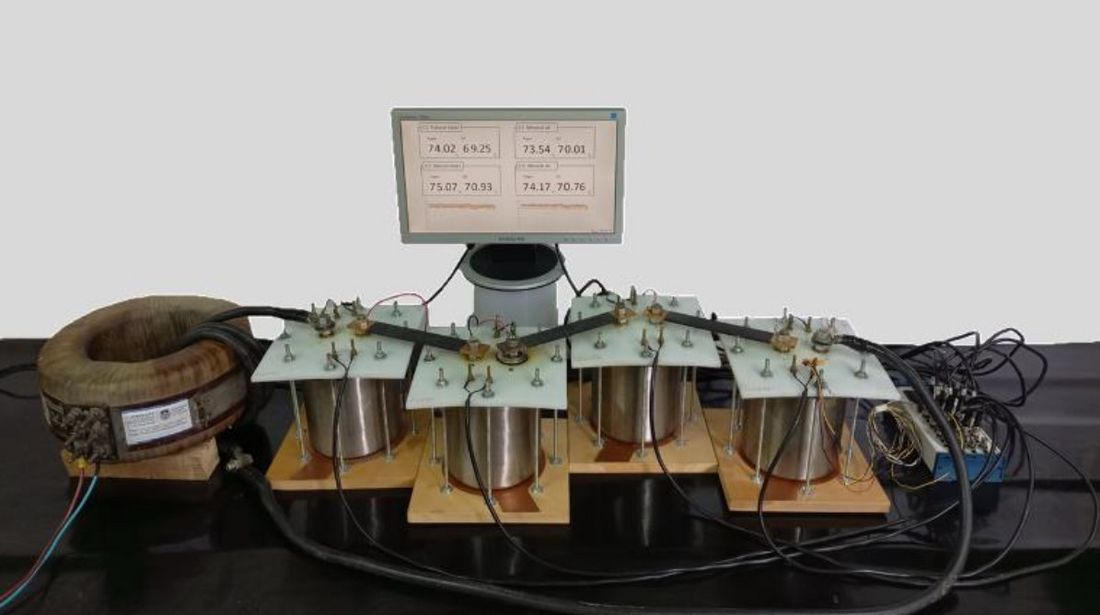
Figure 3 - Setup during non-accelerated aging
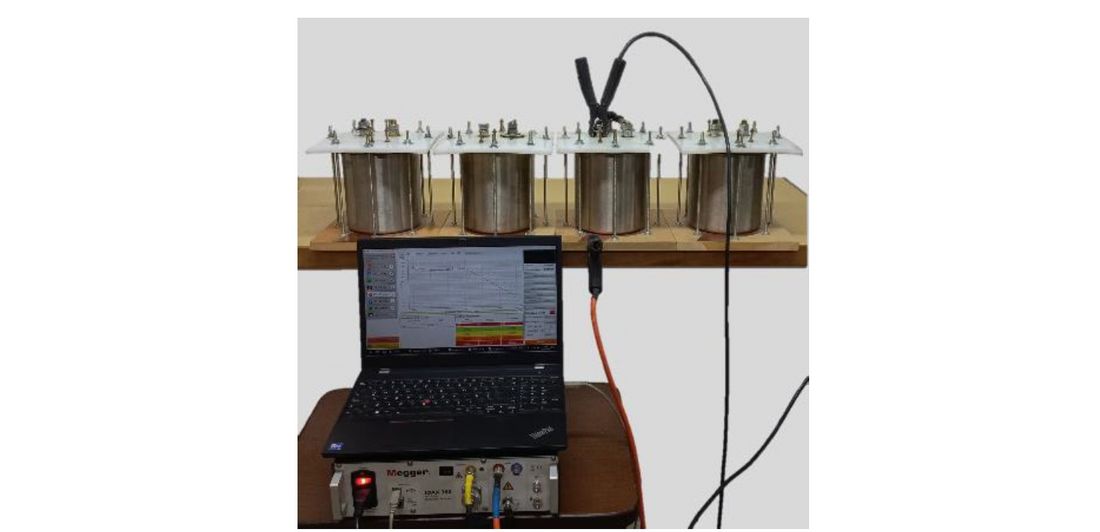
Figure 4 - DFR measurements
5. Experimental results
5.1. Degree of polymerization
Three DP values were obtained from each of the four cells. The tests were conducted following ASTM D 4243, and the results are presented in Table I.
| Test N° | Time [h] | E1 | E2 | M1 | M2 |
|---|---|---|---|---|---|
| 1 | 0 | 964 | |||
| 2 | 10000 | 841 | 929 | 905 | 929 |
| 3 | 44640 | 811 | 893 | 407 | 631 |
In Figure 5, the DP values are graphically represented over time for each cell. In this representation, the trend of DP values for each model can be observed.
According to the results, the DP value for the models immersed in natural esters has decreased by an average of 12 % compared to the new paper. Conversely, in the models immersed in mineral insulating liquid, the DP value has experienced an average decrease of 46 % compared to the new cellulose.
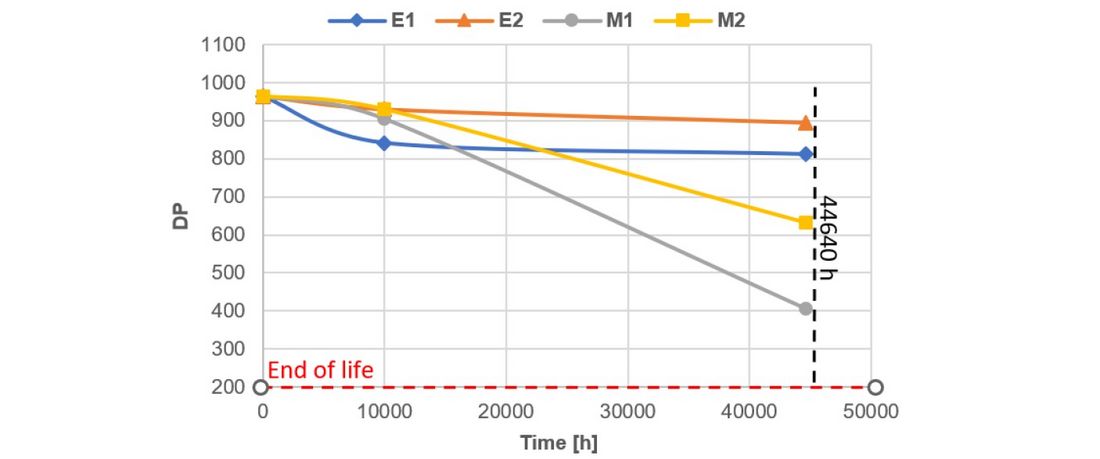
Figure 5 - DP value vs. non-accelerated aging time
In the graphical representation, it can be observed that, based on the measurements, the DP value for the paper immersed in natural ester gradually decreases over time, while in models with mineral insulating liquid, the decrease of the DP value is significantly more pronounced. This is partially explained by the fact that, during the first 10000 h, the thermal stress was not enough to show a clear degradation. In this sense, the E1 cell was the one that degraded the most up to that moment. This behavior may be associated with a higher average temperature, mainly of the insulating liquid, correlated with a slightly higher dissipated power than the rest of the cells (possibly due to small constructive and assembly differences).
This behavior was maintained until approximately 25200 h of aging. From that moment on, an increase in the ambient temperature was observed, which led to a similar increase in the temperatures of the cells. However, the M1 cell had a higher increase in temperature compared to the other cells, both for the insulating liquid (approximately 7 °C more) and the paper (approximately 5 °C more), accompanied by an increase in power loss. Must be highlighted that according to the guide for loading mineral-insulating liquid-immersed transformers (IEEE C57-91), such temperature difference significantly increases (almost two times) the accelerating aging factor. This difference in the M1 cell was maintained until 38400 h (time after the DFR test). After that time, both the paper temperature and the loss power of that cell decreased in value, although the insulating liquid temperature maintained its value a bit higher (similar to the one established at 25200 h). Considering the average thermal profile over the entire aging time, it is ordered in increasing order as follows: E2, E1, M2, and M1. This ordering is correlated to the measured DP values in the same way.

5.2. DFR tests
The DFR test of each model was assessed in six different time intervals (0.2808, 8568, 10272, 36480, and 44640 h), including one measurement taken before initiating the aging process and another at the end of the experimental process. Before each DFR test, thermal stability in each cell was confirmed, and measurements were conducted at a temperature ranging between 16 and 24 °C.
In all cases, the tests were carried out applying 140 Vrms in a frequency range from 1 mHz to 1 kHz.
As a reference, Figures 6 to 9 represent the variations of tan δ and capacitance corrected to a temperature of 20 °C throughout the aging process for E2 and M2 models[1].
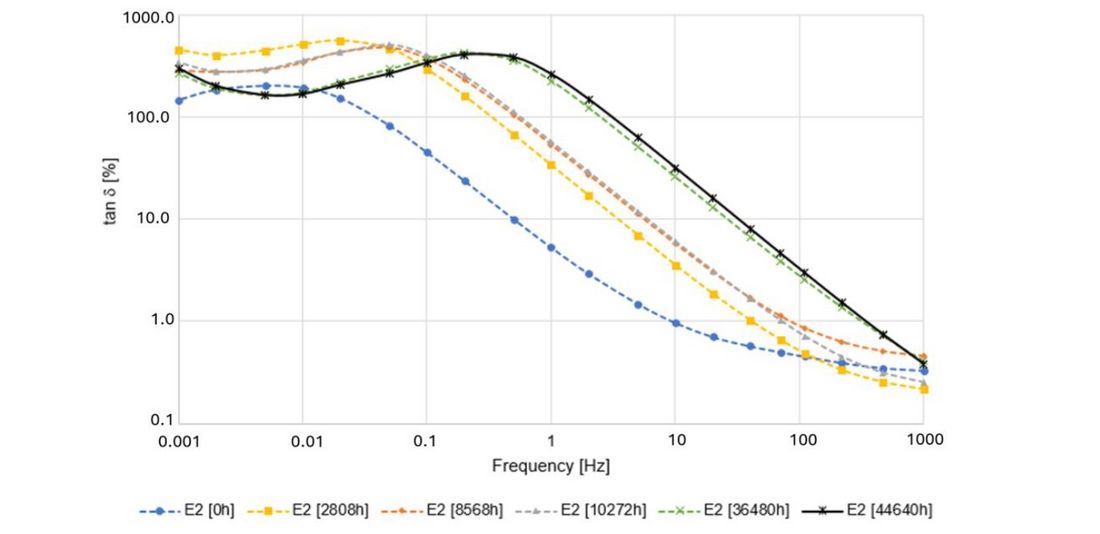
Figure 6 - tan δ vs frequency - E2 model
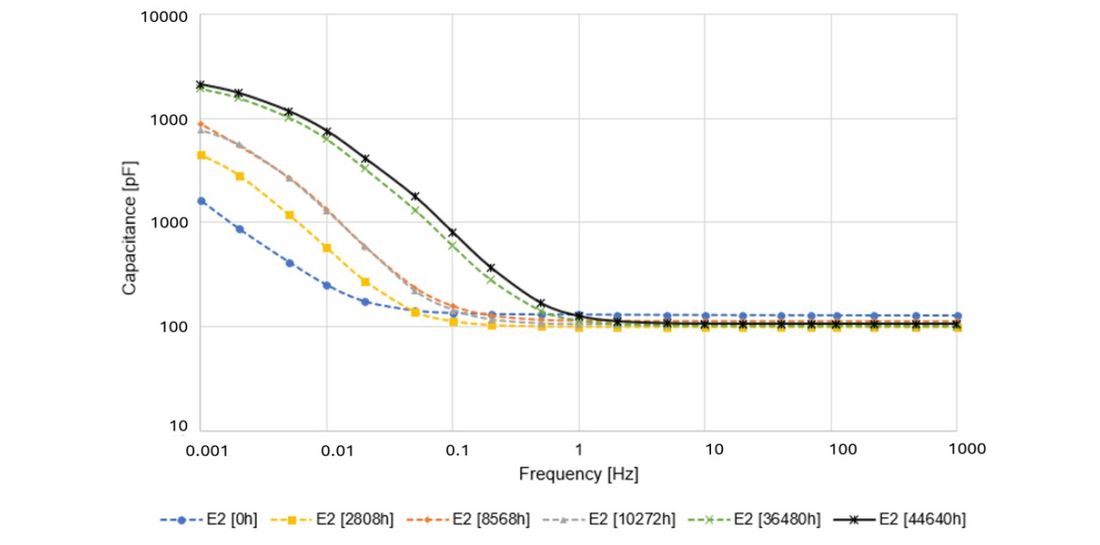
Figure 7 - Capacitance vs frequency - E2 model
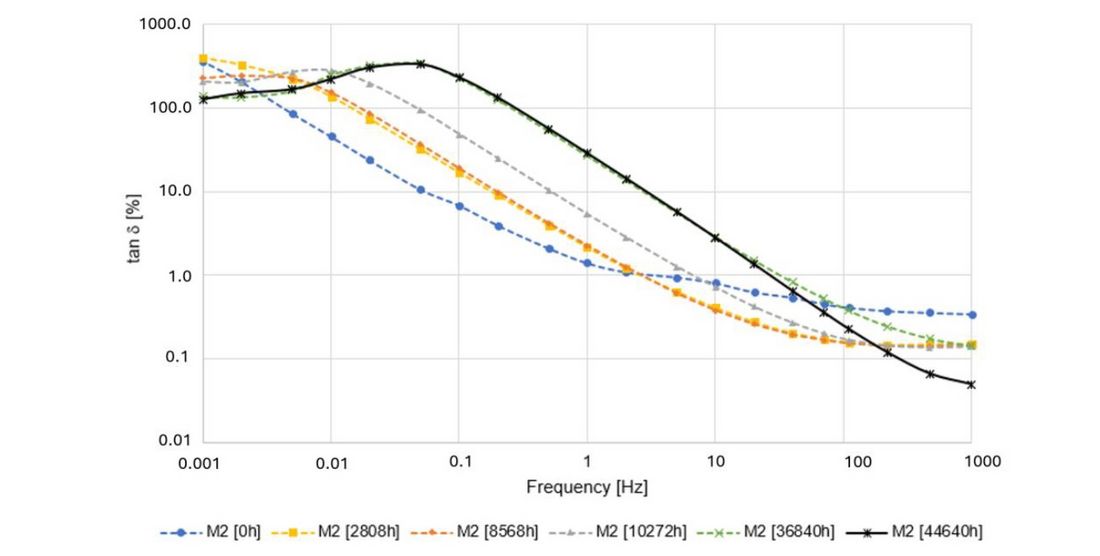
Figure 8 - tan δ vs frequency - M2 model
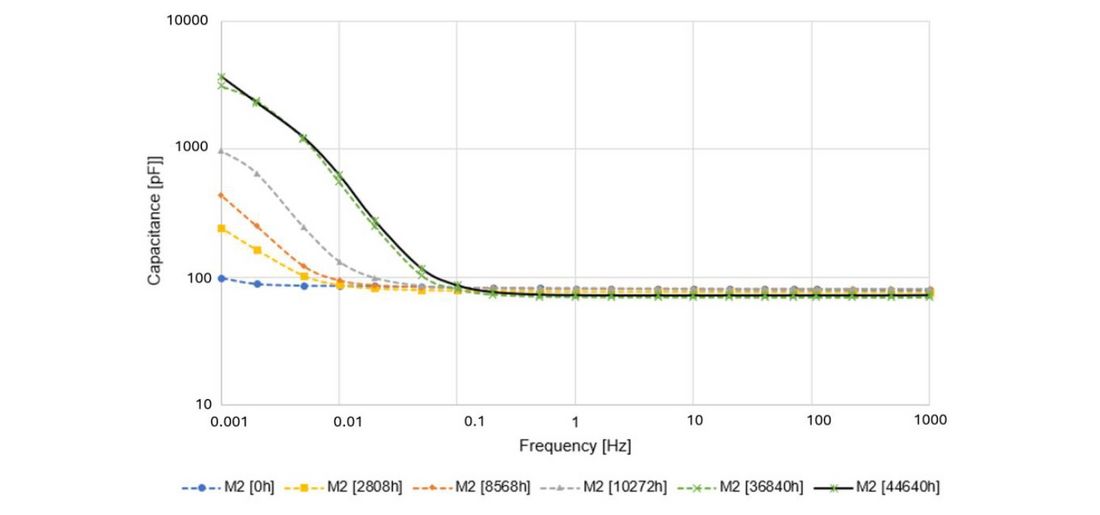
Figure 9 - Capacitance vs. frequency - M2 model
The DFR of physical model E1 reveals significant variation throughout the entire frequency spectrum as compared to the baseline measurement at time t=0 h. There is an increase in capacitance throughout the aging process, especially observed in the frequencies below 1 Hz. This is due to an increase in permittivity, due to a higher polarization inside the material. Additionally, it is observed that between measurements taken at 36480 h and 44640 h, the responses (tan δ and C) are very similar. The linear region at frequencies greater than 1 Hz shows a capacitive change probably due to the physical geometrical change of the insulation in the E1 model.
The DFR of physical model E2 reveals significant variation throughout the entire frequency spectrum as compared to the baseline measurement at time t=0 h. There is an increase in capacitance throughout the aging process, especially observed in the frequencies below 1 Hz. A similar effect was observed in the E1 model. Additionally, it is observed that between measurements taken at 36480 h and 44640 h, the responses (tan δ and C) are very similar. The linear region at frequencies greater than 1 Hz are very similar without major deviations. The difference observed against the baseline measurement above 1 Hz is probably due to the natural slow impregnation process of ester fluids.
The DFR analysis of the mineral insulating liquid model M1 shows a non-typical response in the baseline measurement at t=0 h in frequencies greater than 0.7 Hz. It is expected to see a non-typical response because of the influence of conductive paths on the surface of the insulation container. Therefore, the certainty of moisture analysis using the DFR method is not of high accuracy in the baseline measurement. Analyzing the capacitive response (real component), one can see a linear characteristic in the frequency range greater than 0.1 Hz and a continuous increase in the frequencies below 0.1 Hz. The baseline is almost linear in the entire frequency range and minimal variation is observed throughout the aging process.
The DFR analysis of the mineral insulating liquid model M2 shows a non-typical response in the baseline measurement at t=0 h in frequencies greater than 1 Hz. Otherwise, the analysis of M2 is similar to that of M1. Analyzing the capacitive response (real component), one can see a linear characteristic in the frequency range greater than 0.1 Hz and a continuous increase in the frequencies below 0.1 Hz.
Based on the DFR responses and spectroscopy models, Figures 10 and 11 depict the progression of moisture in paper and the 50 Hz tan δ value of the liquid insulation, respectively.
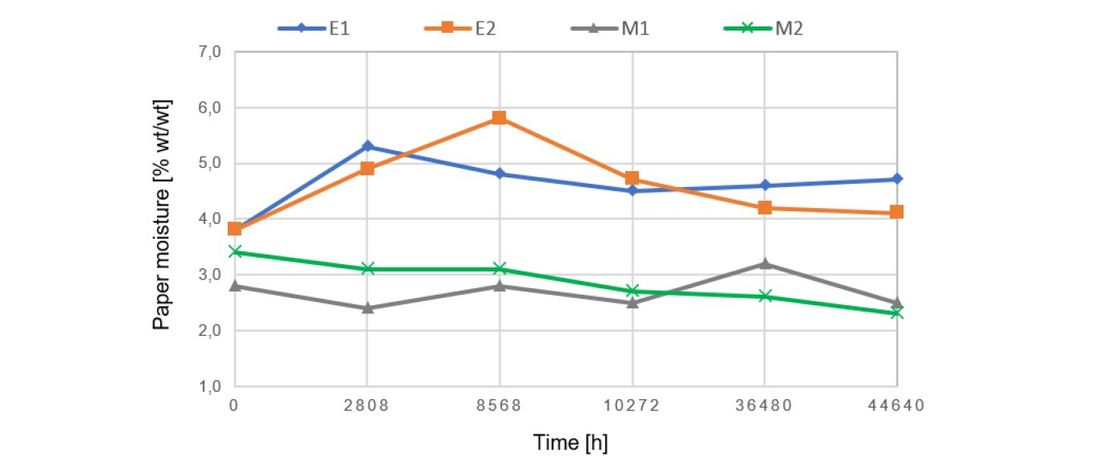
Figure 10 - Moisture in cellulose
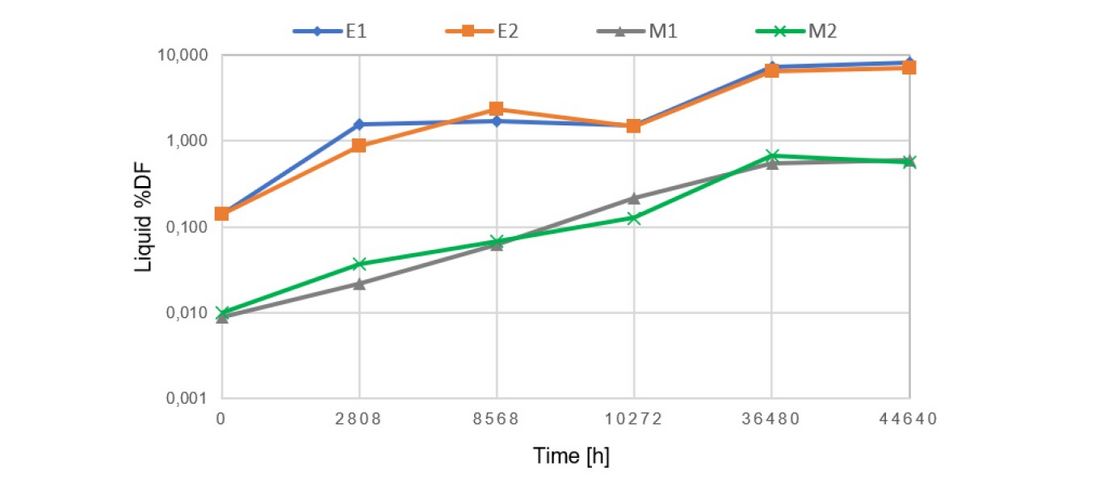
Figure 11 - Dissipation factor liquid
Overall, no significant changes in cellulose moisture are observed during the aging process:
- In models with natural esters, moisture appears to exhibit a slightly decreasing trend. Although, readers need to notice a significant increase in the second or third measurement. The initial discrepancy also observed later in capacitance measurements against the baseline values indicates that impregnation of the ester fluid may not have been completed at t=0 h.
- In models with mineral insulating liquid, a more stable condition is observed throughout the entire process. Drastic moisture peaks were not observed, M1 shows a slightly increasing characteristic whereas M2 shows a slight decrease in moisture.
Moisture analysis needs additional discussion. Important observations are captured thanks to this experimental work to be considered:
- DFR analysis of moisture is based on the reference of specific materials properly characterized by their physical and dielectric properties including activation energy.
- DFR analysis of moisture is based on the well-known XY model where barriers and spacers are considered for the analysis. The models used in this experimental work are based on copper conductors wrapped in Kraft paper. Therefore, accuracy can be improved by generating a better model for the experimental design.
- DFR is temperature-dependent.
At the same time, the most significant changes have been observed in the conductivity of natural ester. For a better and easier understanding, the authors have looked at the %DF instead. The %DF measured for models E1 and E2 show a pronounced increase after 10272 h of aging. Both models depict a similar slope in a linear trendline.
Mineral insulating liquids have also degraded and, even though it is not easy to visualize this change in the plot, the ratio t(@ 44640 h) / t(@ 0 h) is comparable to that of ester fluids.
Table II presents a summary of the relevant ratios of the results obtained in the non-accelerated aging models.
| MODEL | E1 | E2 | M1 | M2 |
|---|---|---|---|---|
| %DF @ t=0 h | 0.141 | 0.139 | 0.009 | 0.01 |
| %DF @ t=44640 h | 8.15 | 7.07 | 0.593 | 0.56 |
| Ratio t(@ 44640 h) / t(@ 0 h) | 57.8014 | 50.8633 | 65.8888 | 56 |
6. Outcome analysis
Experimental studies on accelerated aging have concluded that the thermal aging of cellulose in natural esters results from three forms of protection:
- water has a higher affinity, i.e. water is dissolved by the ester since it can retain a much higher concentration up to saturation than mineral insulating liquids [9].
- hydrolytic protection, i.e., water reacts with esters forming long-chain fatty acids and diacylglycerols, that are not harmful to the cellulose due to their very limited acidity.
- transesterification reactions between the fatty acids and the hydroxyl groups of cellulose [10] even if some other researchers confuted this phenomenon [11].
Considering the DP value and moisture tests on cellulose (estimated from the DFR), it could be inferred that, similar to accelerated aging, hydrolysis in models with natural esters would have had a lesser impact than in the case of models with mineral insulating liquids. The hydrolysis process consumes water-soluble acids while generating long-chain acids that are less harmful to paper. The accumulation of acids and water in the cellulose accelerates the aging process leading to a downward spiral of paper decay. The overall effect of this is that the paper becomes progressively weaker. This could be one possible reason why the integrity of paper is better in natural ester.
From the DFR tests, the increase in insulating liquid conductivity in models with natural esters can be associated with two factors: an increase in moisture and aging byproducts (carbonic acids). However, studies [12] suggest that the effects of moisture have a greater impact. Under these considerations, it would be assumed that the degradation of the liquid and solid insulation is related to moisture and temperature. The aging process is not accelerated by a thermal effect, in this experimental work the aging process is mainly influenced by the hydrolysis effect and, potentially, it has been the reason for the notable increase in the conductivity of the natural ester.
7. Conclusions and recommendations fo future work
This work presents the results of Dielectric Frequency Response (DFR) tests conducted on four insulation models, two immersed in mineral insulating liquid and two immersed in soybean-based natural ester, subjected to non-accelerated thermal aging over a period of 5 years. The primary objectives were to assess the impact of normal aging on insulation materials, evaluate moisture content, and analyze the behavior of the dielectric response.
It is impossible to consider the experimental work on two models to be sufficient to establish definitive conclusions about the behavior of ester fluids but it is of great importance to get the recommendations for future experimental work. Some of them are:
- The analysis of DP values indicated a decrease in cellulose integrity over time. Samples extracted from the models immersed in natural ester exhibit a mild reduction of DP as compared to mineral insulating liquid. This suggests that natural esters may provide better protection against hydrolysis, preserving cellulose integrity during the aging process.
- DFR tests revealed distinct responses in tan δ and capacitance for both insulation types. The moisture content estimation using the XY model may lower the accuracy of the assessment if the model is different from the typical winding insulation design.
- The impregnation process of natural esters takes longer than that of mineral insulating liquid. Discrepancies might be observed in the capacitance values due to poor impregnation. The process of impregnation can be monitored by measuring capacitance as a function of time till it reaches stability.
- The %DF as an indicator for liquid insulation degradation sounds “scary” in ester fluids. The idea of using a ratio between the last and the original measurements shows that both materials are degrading on a similar scale under “normal” operational conditions.
- A DFR database dedicated to assessing natural ester fluids has been used but it is not of public domain.
- The DFR database used in this project is to be used in real operating units to be better validated.
- Future work should involve further validation of findings by testing transformers in the field with 5 or more years of service.
- Additionally, experiments with different paper insulation and alternative fluids are needed to enhance the generalizability of the results.
- The study emphasizes the importance of considering non-accelerated aging conditions to obtain a more accurate assessment of insulation materials' long-term behavior, offering valuable insights for the transformer industry.
References
- V. Vasconcellos et al., “Increased loadability of transformers using natural ester and cellulosic materials as high temperature insulation systems,” IEEE Electr. Insul. Mag., vol. 34, no. 5, pp. 8–17, Oct. 2018.
- CIGRE Technical Brochure 436, “Experiences in service with new insulating liquids,” Working Group A2.35 CIGRE, Oct. 2010.
- CIGRE Technical Brochure 738, “Ageing of liquid impregnated cellulose for power transformers,” Working Group D1.53 CIGRE, 2018.
- F. Scatiggio, G. Campi, E. Wang, and R. Szewczyk, “Supporting the development of transformers with natural esters,” in CIGRE Paris 2022, Paris, France, 2022.
- CIGRE Technical Brochure 349, “Moisture equilibrium and moisture migration within transformer insulation systems,” Working Group A2.30 CIGRE, Jun. 2008.
- IEEE Std C57.161-2018, “IEEE Guide for Dielectric Frequency Response Test,” Nov. 2018.
- J. Jalbert and M. -C. Lessard, “Cellulose chemical markers relationship with insulating paper post-mortem investigations,” IEEE Trans. Dielectr. Electr. Insul., vol. 22, no. 6, pp. 3550–3554, Dec. 2015.
- P. Werelius, M. Ohlen, Jialu Cheng, and D. M. Robalino, “Dielectric frequency response measurements and dissipation factor temperature dependence,” in 2012 IEEE International Symposium on Electrical Insulation, San Juan, PR, USA, Jun. 2012, pp. 296–300.
- F. Vahidi, S. Haegele, S. Tenbohlen, K. Rapp, and A. Sbravati, “Study on moisture influence on electrical conductivity of natural ester fluid and mineral insulating liquid,” in 2017 IEEE Electrical Insulation Conference (EIC), Baltimore, MD, USA, Jun. 2017, pp. 290–293.
- C. P. McShane, K. J. Rapp, J. L. Corkran, G. A. Gauger, and J. Luksich, “Aging of paper insulation in natural ester dielectric fluid,” in 2001 IEEE/PES Transmission and Distribution Conference and Exposition. Developing New Perspectives (Cat. No.01CH37294), Atlanta, GA, USA, Nov. 2001, pp. 675–679.
- H. Wilhelm et al., “Thermal behavior evaluation of a new solid insulating paper in natural ester and mineral insulating insulating liquids,” in 2022 IEEE Electrical Insulation Conference (EIC), Knoxville, TN, USA, Jun. 2022, pp. 358–361.
- D. Linhjell, L. Lundgaard, and U. Gafvert, “Dielectric response of mineral insulating liquid impregnated cellulose and the impact of aging,” IEEE Trans. Dielectr. Electr. Insul., vol. 14, no. 1, pp. 156–169, Feb. 2007.

- [1] In order to make a clear comparative analysis, curves were normalized to 20 °C using the Individual Temperature Correction (ITC) algorithm.
