B2 - Improved model for overhead line audible noise prediction
Authors
Oliver PISCHLER, Uwe SCHICHLER - TU Graz, Austria
Isobel GREEN, David Borrie - SSEN Transmission, Scotland

Summary
Corona induced audible noise emitted by overhead lines is known to be a serious environmental issue, which also influences public acceptance of overhead line projects. In the case of AC overhead lines, this phenomenon mostly occurs during foul weather (e.g., rain, snow, fog). To be able to estimate the corona noise emitted by a planned overhead line, empirical prediction models were already developed in the 1970s. These models are based on measurement results of several outdoor test lines, which were then extrapolated to different conductor bundle geometries. The developed prediction formulas have proven their validity many times in the past and are still widely used today. More recently, however, several weaknesses have become apparent, most notably in accounting for the influence of the rain rate and for hydrophilic conductor surface treatments, which are now increasingly used to reduce corona noise. Additionally, precipitation events with very low rain rates (such as fog and mist) are covered poorly by existing formulas. While the quality of the existing models is certainly impressive, particularly given their age and breadth of parameters covered, it is questionable whether their accuracy is sufficient in light of increasingly stringent noise limits and the changing climate.
These shortcomings were recently observed in a newly installed overhead line. Noise predictions had indicated that no issues were to be expected for this line. In reality, however, a number of complaints were filed shortly after the first energization, particularly at very low rainfall rates. This contribution discusses how this particular problem was analysed and subsequently solved.
To gain a deeper insight into the noise emission behaviour of conductor (bundles) with treated as well as untreated conductors at different rain rates, two different experimental approaches were pursued. On the one hand, the overhead line in question was equipped with sensors for long-term measurement of the climatic conditions and the occurring noise levels. In particular, a disdrometer was used, which allowed a detailed characterization of the precipitation. On the other hand, tests were carried out in an acoustically optimized high-voltage laboratory under controlled conditions.
The aim of the tests was to check the validity of existing audible noise prediction models under different climatic conditions. Due to the observed phenomena, very low precipitation rates were the focus of the investigations. Additionally, the tests should also help to gain a better understanding of the operating behaviour of hydrophilic conductors. Hereby, the aim is to ensure the optimisation of noise reduction as far as reasonably practical to mitigate future third-party disturbance.
The measurements carried out on the overhead line as well as the laboratory tests clearly indicate that the noise levels occurring at very low rain rates can be higher than those occurring at medium rain rates. Additionally, the results collected conclusively show that surface treatments can indeed provide significant noise reduction. However, it was found that the noise reduction potential decreases with increasing conductor surface gradient. Regarding the validity of existing prediction models, it was observed that although they provide a consistent trend regarding the expected noise level, their results mostly lie between the measurement results for untreated and treated conductors. The noise levels occurring at very low rainfall rates are consistently underestimated in existing models and thus insufficiently covered in the prediction.
The experience shared in this contribution is intended to show how various measurements can help to improve prediction accuracy. From a theoretical point of view, the shortcomings of existing models are addressed. From a practical point of view, this contribution shall raise awareness regarding corona induced audible noise at very low rain rates as well as the optimal utilization of hydrophilic conductors.
Keywords
Audible Noise, overhead Lines, Conductor Audible Noise, Corona, Rain Rate, Disdrometer, Hydrophilic, Surface Treatment1. Problem Definition
The UK electricity sector is undergoing a period of profound and sustained change in response to the immediate challenges posed by climate change. In response, the existing transmission network must rapidly transform from one designed to transfer power between a limited number of large power plants and load centres, to a system capable of handling large bulk power flows from the proposed renewable generation largely sited in the north of Scotland to the existing load centres in the midlands and south of England.
Currently, it is proposed that an additional 50 GW of capacity will be required by 2030 to meet the UK and Scottish government targets [1]. Of that, as much as 27 GW of capacity will be required within the North of Scotland Transmission Network [2]. This change requires the construction of multiple new 400 kV overhead transmission lines (OHL) in parallel with the simultaneous uprating of existing transmission lines currently operating at 275 kV (Fig. 1) [3].
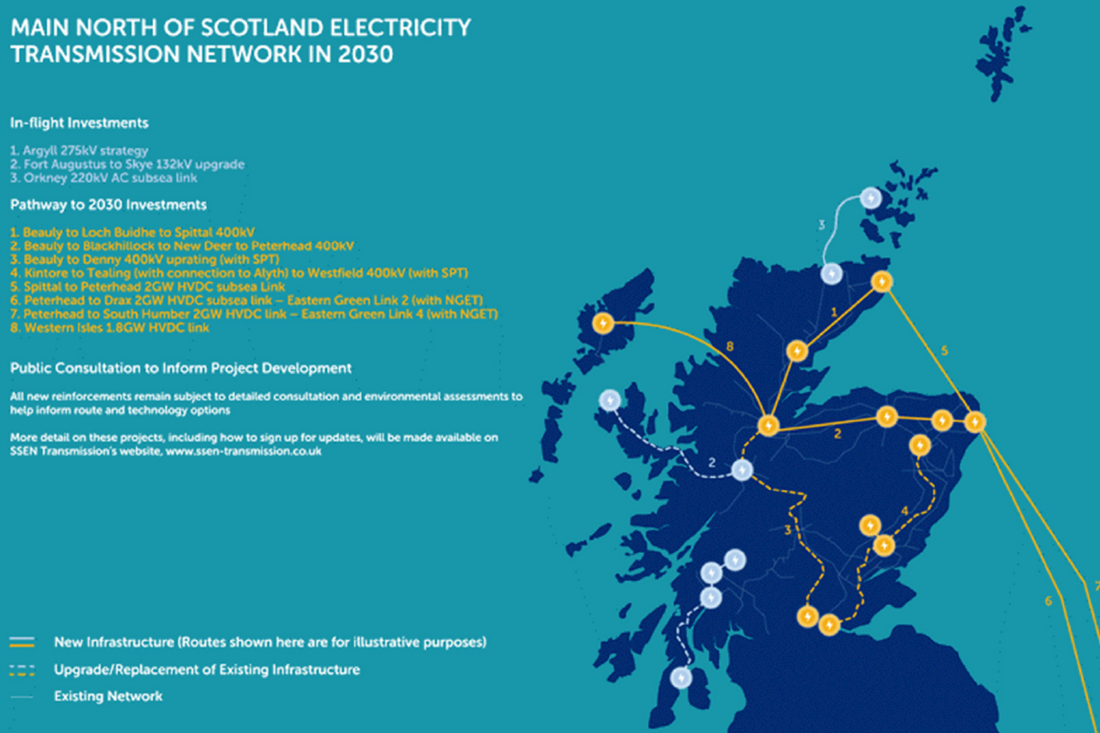
Figure 1 - New infrastructure and upgrade/replacement projects in the main north of Scotland [4]
At nominal operating voltages of 275 kV and above overhead transmission lines can generate audible noise (AN) particularly in foul weather conditions [5]. These noise emissions are generated by corona discharges, effectively the partial breakdown and ionisation of the air, when the localised electric field strength is distorted and enhanced by individual water droplets on the surface of the conductor [6].
Such noise can, if excessive, cause public nuisance and may be sufficiently severe to contravene statutory environmental noise legislation. The mitigation of such issues can sometimes be resolved at a local level using residential soundproofing technologies (e.g. secondary glazing or new double/triple glazing). However, with an increasing rural population in the countryside solutions of this type are becoming increasingly infeasible.
As such, the estimation of acoustic noise generated from discrete overhead line designs, and the subsequent alignment of those overhead lines along routes correctly distanced from third party properties is becomingly increasingly critical.
Currently, the standard industry legacy models for the estimation of overhead line noise are based on a combination of field experiments and laboratory testing performed by EPRI and its predecessors in the 1970s. Field tests used within the development of these models were limited by the rudimentary nature of the available meteorological equipment used to measure the rain rate in real time. This limitation effectively excludes knowledge of acoustic noise at very low rain rates where measurements were technically impossible [7, 8].
Further, the range of conductors, although extensive, focused exclusively on environmentally “moderately aged” conductors whose surface condition was largely hydrophilic [8]. Conductors of this type tend to accumulate fewer water droplets on their surface during foul weather events. New conductors are typically hydrophobic as a construct of the unblemished surface and the presence of drawing oils on the conductor surface. This property leads to the formation of numerous water beads around the conductor, which cause higher noise levels (Fig. 2).
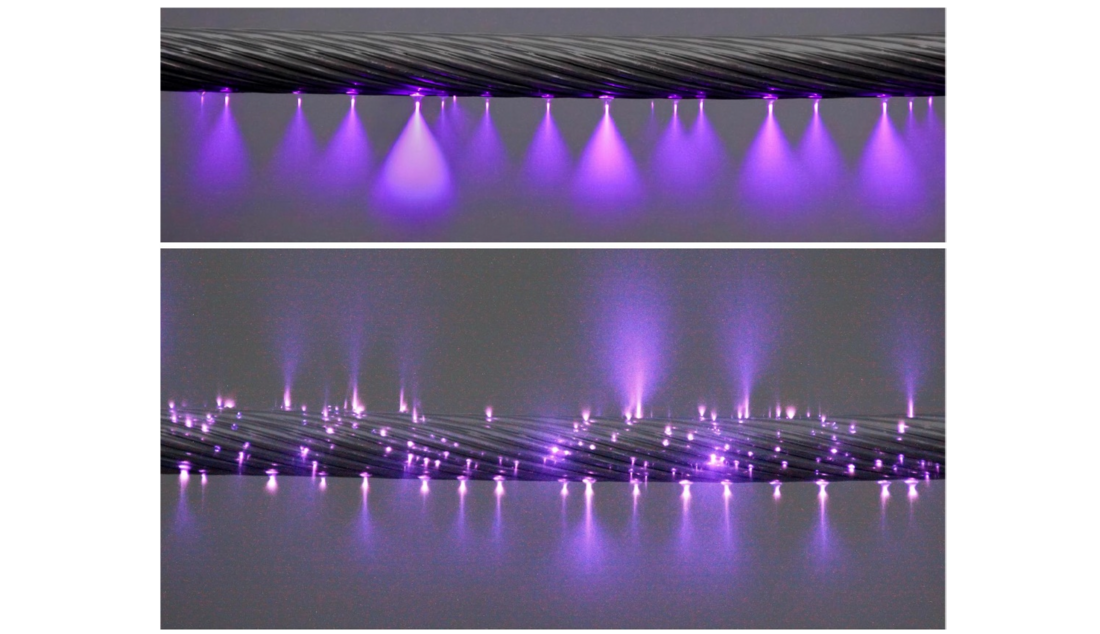
Figure 2 - Corona discharges caused by water drops on a hydrophilic OHL conductor (top), untreated, new conductor (bottom)
Historically, due to high levels of air pollution, the surface of the conductor rapidly degraded or aged over a relatively short period of time, perhaps months [9]. With the advent of greater environmental regulation, the ageing process is estimated to take several years meaning that the noise generated by conductors can significantly exceed that estimated using legacy theoretical models [10]. Hence, there is a real need to understand the noise associated with new conductors to mitigate future third-party complaints post energisation.
Manufacturers recognising this issue have in response developed a range of surface treated conductors which are inherently hydrophilic. Although intuitively the performance of such conductors should offer significant improvements in acoustic noise performance, no theoretical models exist to quantify this benefit in the context of practical environmental assessments [6, 11].
2. Meteorologically defined parameters for very low rain rates
Apart from the geometry of an overhead line and the resulting electric field strength, corona-induced noise emissions are particularly influenced by the amount of water accumulating on the overhead line conductors. The influence is particularly pronounced in the range of low rainfall rates (e.g., drizzle, mist, or fog) [8, 12]. It is therefore essential to precisely classify precipitation events with very low rain rates (VLRR), which can hardly be detected with conventional rain sensors, and to investigate their effects in detail. In such scenarios, it is possible for the surface of the conductor to be become saturated with water but there is no simultaneous increase in background noise from rainfall to mask the conductor acoustic noise. To meaningfully define the parameters for the assessment of conditions associated with VLRR, it is necessary to firstly classify both the size and density of water droplets. In the first instance, published meteorological data was referenced to describe the phenomena, and secondly, field measurements were conducted with a disdrometer gain further insight (Section 4).
A review of literature has indicated that VLRR can take the form of rain, or mist and [13]. Very low rain rates are defined as precipitation rates below what standard observing instrumentation can measure (< 0.2 mm/h). Rain and drizzle are differentiated by droplet size with drizzle being below 0.5 mm in diameter and rain above 0.5 mm in diameter [14]. Over time, both drizzle and rain can produce precipitation accumulations from sub-measurable to heavy.
Fog and mist droplets are formed on aerosol particles in a supersaturated atmosphere. The distinction is made on the basis of optical visibility which is a function of droplet density [15]. A high density of suspended water droplets would produce fog (visibility less than 1 km), while lower densities of water droplets would produce mist (visibility greater than 1 km).
Fog and mist droplets tend to be much smaller than precipitation (approx. 4 – 20 μm). If the water droplets grow larger, they can fall as precipitation. The different mechanisms associated with fog formation are known to affect water droplet size. Radiation fog tends to have smaller droplets with a peak around 5 μm but can extend up to 15 μm. In comparison, advection (sea) fog produces larger droplets around 15 – 20 μm [16].
3. Estimation and environmental assessment of conductor acoustic noise
To be able to interpret the results of noise predictions, field measurements or laboratory tests, it is necessary to know the noise thresholds to be applied for different areas. The exposure limits to be adhered to in Scotland are based on the findings of the WHO, according to which a limit of 45 dB(A) must be adhered to outdoors at night. However, lower limits are specified in some cases to protect vulnerable groups (e.g. < 35 dB(A) for care homes, children's residential homes, hospices and hospitals). The detailed analysis is carried out as part of an Environmental Impact Assessment (EIA), which draws together an assessment of any significant environmental impact created by a new development (e.g., the building of a new circuit, uprating or diversion of an already built circuit) [17].
One of the documents included within the submitted evidence is an assessment of the audible noise impact on local Noise Sensitive Receptors (NSR). The “Operational Audible Noise Assessment Process for Overhead Lines (New Build, Reconductoring, Diversion and Uprating)” outlines a three steps assessment process to determine the potential impact to local communities by the development [18].
To complete the assessment, the surface gradient of the conductor surface and the L50 (noise level that is statistically exceeded in 50% of all rain events) and L5 (exceeded only in 5% of all rain events) noise levels at the NSR are estimated. Finite Element Method (FEM) field calculations are carried out to determine the surface gradients of the conductor bundles and then these are used with the EPRI formula to estimate the L5 and L50 audible noise levels. Historically, the assessment method defined the L50 and L5 noise values correlating to a natural rain intensity of 0.75 mm/h and 6.5mm/h respectively [8].
Both Tier 1 and 2 assessments concentrate only on the L50 estimated noise. The Tier 1 assessment looks at it from a “worst-case” wet noise effect while the Tier 2 assessment evaluates the combined wet noise and dry noise effects. This is based on average yearly rain fall taken from the Met Office Rain Fall Map which only considers precipitation rates above 0.2 mm/h. The Tier 3 assessment evaluates the effect of both wet and dry noise following the principles of BS 4142:2014 [19]. The assessment does not consider frequency of precipitation events such as those with VLRR in the rain map as historically this was not considered to be an issue.
4. Field measurement case study
In a recent case study, the noise characteristics of a newly built overhead line, with each phase consisting of a single Araucaria conductor energised at 275kV, did not conform to the values calculated in the EIA assessment. In theory, with the OHL 132m from the NSR, there should not have been an issue with noise at the location. However, sound pressure meter results taken under the line and at the NSR clearly indicate noise levels higher than acceptable limits. A corona camera was used to isolate the issue and to confirm that the noise was in fact caused by coronating conductors.
Sample tests were undertaken on the conductor to confirm the grease class and the absence of excessive grease on the conductor surface. It was hypothesised that the higher-than-expected noise levels could be due to the local environmental conditions. The location sits within a valley where temperature inversion resulting in mist and fog is extremely common. It is also a region of Scotland that commonly experiences phenomena such as drizzle and very low rain rates as described in Section 2.
A weather station, including a Parsivel disdrometer unit and an NL-52EX Class 1 Sound Level Meter were installed directly under the line. The disdrometer unit uses a laser to measure the size and speed of falling particles, indicating the droplet speed, diameter and size distribution. The raw data is then used to calculate the type, amount, and intensity of the precipitation along with the visibility (Fig. 3).
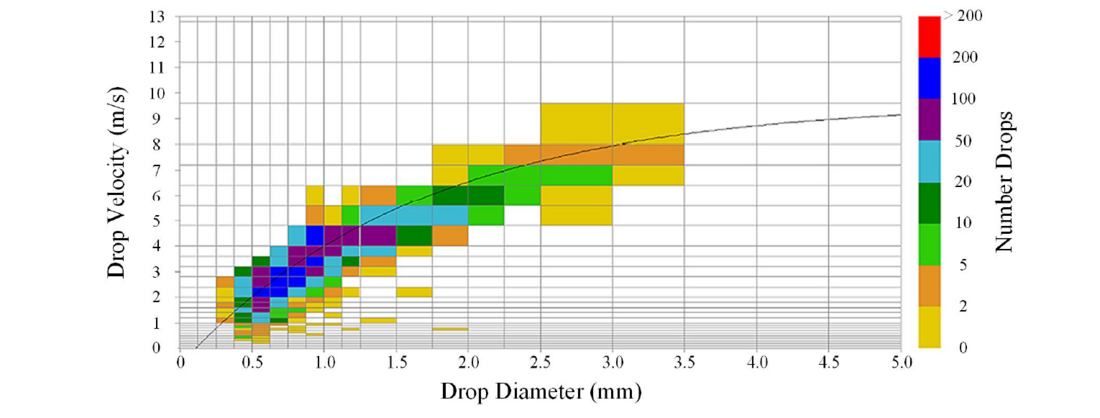
Figure 3 - Exemplary measurement results from disdrometer, precipitation droplet size against velocity for a single data point
With this measurement setup, rain rates and noise levels were recorded at five-minute intervals over three consecutive days. Figure 4 gives an overview of the sound pressure levels recorded at rainfall rates between 0 – 4 mm/h. Additionally, the noise levels estimated with the EPRI model for these same rain rates is shown. For this comparison, the geometry of the tower and sag profile of the conductors at the position of the measurement setup were used to estimate the noise level. The geometry parameters and surface gradients are listed in Section 5.
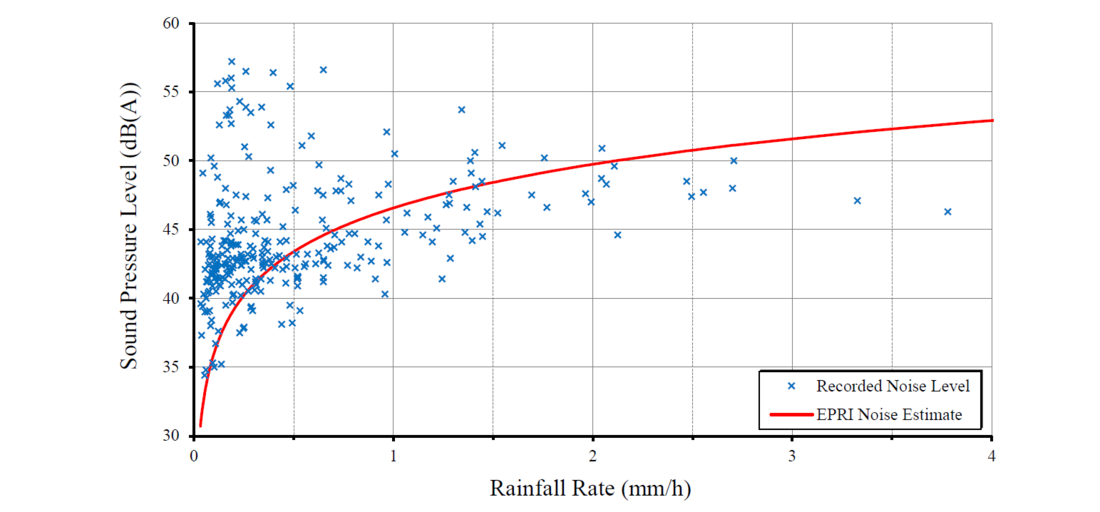
Figure 4 - Comparison between sound pressure levels measured on-site at different rainfall rates and corresponding noise levels estimated with the EPRI prediction model
Above rain rates of 0.4 mm/h, the recorded sound pressure level (SPL) can be seen to broadly align with the values estimated using the EPRI methodology. However, in contrast, at rain rates below 0.4 mm/h the recorded SPL values can be seen to be uniformly greater than the EPRI estimation by between 5 – 10 dB(A) in places. Therefore, at such VLRR there is a significant risk of causing third-party disturbance underlining the need to refine the applied formulae in this area.
The large variance in SPL at VLRR below 0.4 mm/h can be explained when considering the temporal distribution of recorded SPL and rainfall rate with respect to a 24-hour period (Fig. 5).
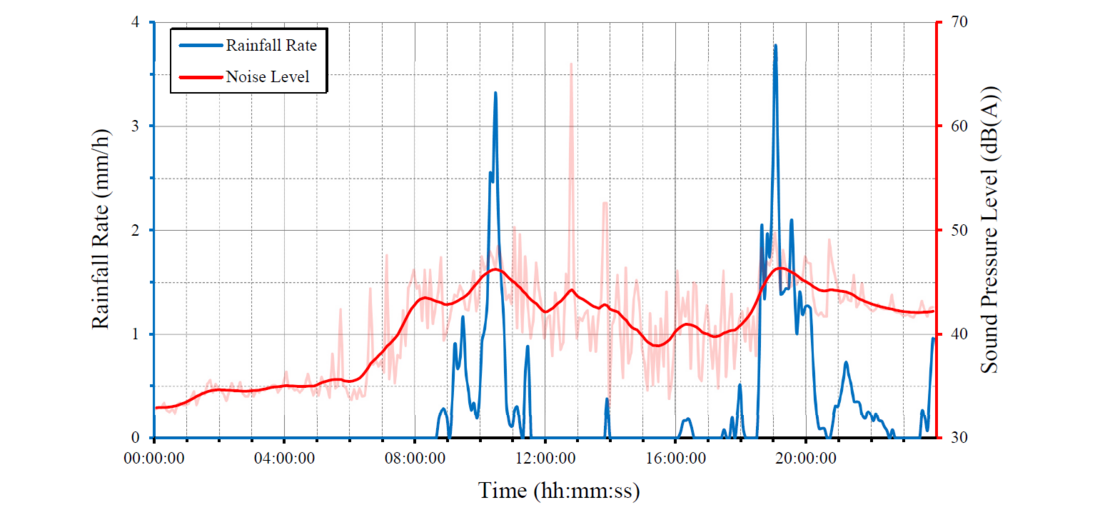
Figure 5 - Recorded sound pressure level and rainfall rate over a 24-hour period
It is hypothesised that the increase in SPL from around 06:30 – 08:30, when no discernible precipitation was actually detected, is probably due to precipitation rates below the threshold of the disdrometer, causing an increasing accumulation of water droplets on the OHL conductors. The subsequent onset of increasing precipitation is detected by the disdrometer. The SPL continues to increase until it peaks around 10:30 when there is maximum rainfall. The temperature over this 24-hour period does not increase over 2 °C. In combination with high humidity and bouts of very low precipitation during the period 11:30 – 18:30, the conductor surfaces remain saturated with water drops, which in return causes the SPL to stay consistently higher than it was before the onset of precipitation. The SPL level increases once more with the onset of rain at 18:30, peaking at 49.8 dB(A), before maintaining a SPL above 42 dB(A) for the rest of the period until 00:00.
This data suggests that periods of VLRRs result in high SPL if the conductor surface is saturated with water droplets, explaining the high variance in results at such low rates. This is likely happening either due to an extended period of exposure to VLRR with very low to no wind speed or the period after rain in which the temperature is low enough and VLRRs are still present, so the conductor remains saturated.
With further research required to draw full conclusions from the field measurements that would present a conclusive solution, the solution in this case was based on the noise reduction that could be gained from a larger, treated conductor bundle based on laboratory experiments.

5. Laboratory experiments
In order to further investigate the influence of the rain rate on the noise emission behaviour of different conductors, tests were carried out in an acoustically optimized high-voltage laboratory. The test setup allowed the setting of arbitrary rain rates, which can also be kept constant over longer periods of time. To gather meaningful results, which can be used for a prediction model later on, it is necessary to perform noise emission measurements under conditions as close to reality as possible. Therefore, all investigations described below were carried out on full scale conductor bundles of 10 m length, which were mounted 3 m above ground. The ends of the conductor samples were shielded with corona rings to ensure that the measurement setup itself is free of discharges. The test voltage was supplied with a 1500 kV AC cascade (Fig. 6).
Constant precipitation rates were achieved with a special artificial rainfall simulator (6 m x 1 m), which was mounted above the conductors and which was supplied by a pressure buffered water supply system. The water supply system was equipped with a flow regulator as well as flow and pressure meters. To be able to set the rain rate by adjusting the flow regulator, a suitable calibration was carried out before the actual noise measurements.Additionally, a spray system with 20 individual 0.3-mm-nozzles was used to study audible noise emissions under very low rain rates (Fig. 7). The spray system was suspended 3 m above the conductor bundle. The nozzles were spread in two rows (0.5 m apart) over a length of 10 m. The system was operated with deionized water at a constant pressure of 5 bar.
The acoustic quantity most readily accessible in such laboratory measurements is the sound pressure level evoked by the coronating conductor bundle at a certain observation point in the laboratory. However, the sound pressure level’s significance is quite limited, as it strongly depends on the distance between the observation point(s) and the emitting conductor bundle. As long as the measurement setup remains unchanged, the sound pressure level can be used to compare the emission characteristics of different conductors and bundle configurations. However, to be able to make noise predictions, the measured sound pressure levels were converted to the underlying invariant source quantity, which is the sound power level using a method similar to [12]. In the present case, the sound power level describes the acoustic power emitted by the bundle conductor per unit length. Although the sound pressure level as well as the sound power level both use the unit “dB(A)”, the respective reference values are different. In case of the sound pressure level a reference pressure of p0 = 20 μPa is used, while in accordance with the values provided by EPRI a reference power of P0 = 1 μW is used in this contribution for the sound power level. To express the sound power levels emitted by a conductor bundle as a function of the surface gradient, the respective test voltages are converted to surface gradients using FEM calculations.
The surface gradient dependent sound power level per unit length A’A(E) represents the key variable covered by prediction formulas such as the EPRI model. The determination of this parameter in laboratory tests for a certain bundle conductor arrangement with conductors with a specific surface at relevant rainfall rates subsequently enables very detailed and reliable noise predictions to be made.
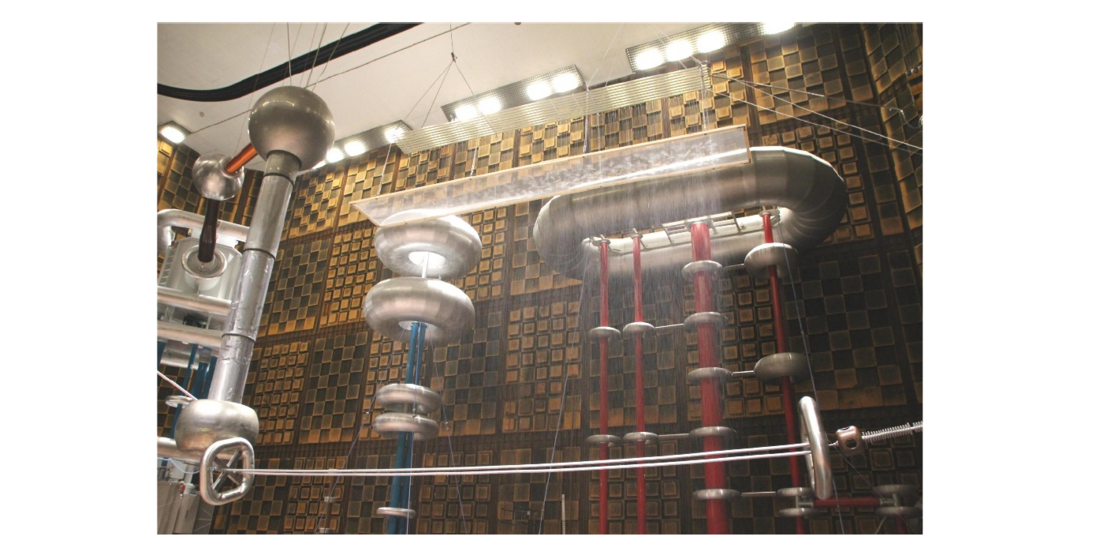
Figure 6 - Laboratory setup for AN tests with rainfall simulator
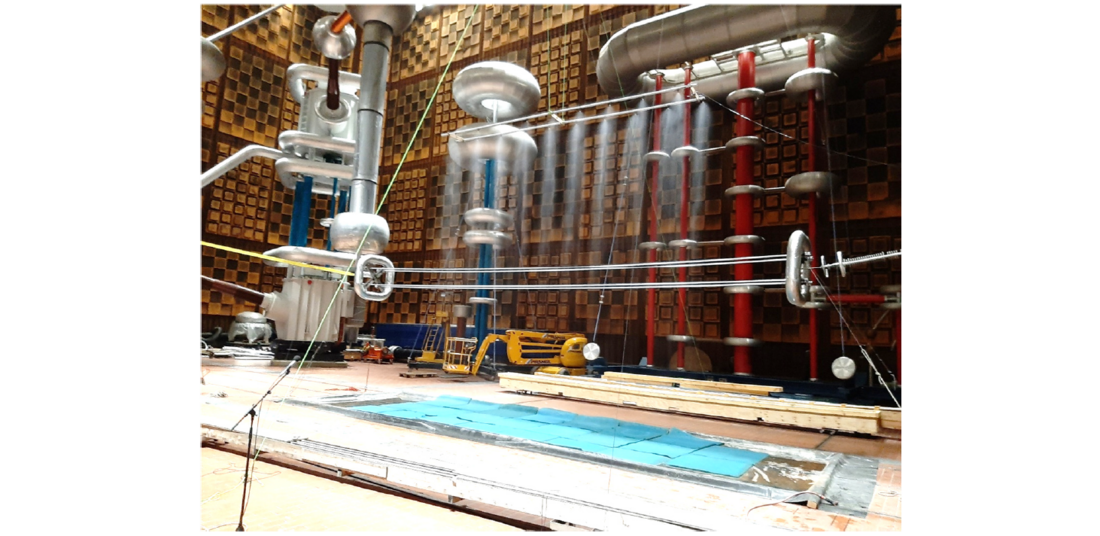
Figure 7 - Measurement setup with spray system for AN tests at VLRR
Three different types of conductors with and without hydrophilic surface treatments were analysed for the present investigations. The rainfall rates were set according to the values measured on the overhead line (Section 4). To allow the results to be used more readily for noise predictions, fitting factors were calculated that allow the emission behaviour to be characterized with only three variables (Eq. (1), Tab. 1). It ought to be noted that these parameters are only valid for surface gradients E > 10 kV/cm.
(1)
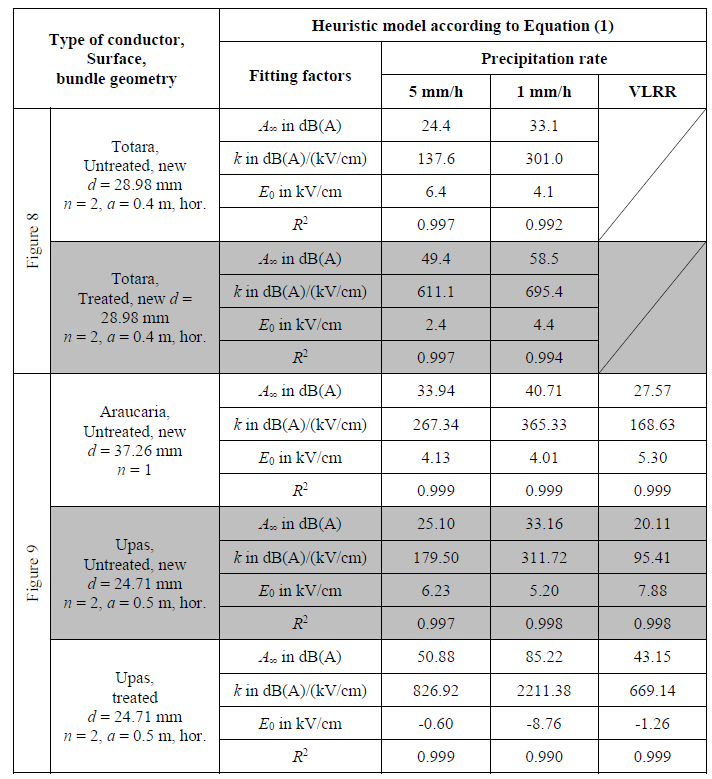
Table 1 - Investigated conductors (including type of surface and bundle geometry) and fitting factors obtained from measurements according to Eq. (1)
Fig. 8 shows the results of the noise emission tests carried out on twin-conductor bundles with untreated and treated Totara conductors at rainfall rates of 5 mm/h and 1 mm/h. The depicted noise emission curves show that hydrophilic conductors indeed exhibit significantly lower emission values than untreated conductors. However, the difference between the two conductors decreases steadily until the emission lines of the untreated conductors and the treated conductors intersect around EI ≈ 19 kV/cm. This can be explained by the corona discharge behaviours of the different surface types under wet conditions. As previously stated, a high number of water drops, which are the source points of the noise generating discharges, can be found around the whole circumference of untreated conductors. On hydrophilic conductors, water drops only accumulate on the conductor’s bottom side. The discharge activity continuously increases for surface gradients E exceeding the corona onset gradient. However, with the increasing accumulation of space charges around the conductors and the accompanying mutual shielding of adjacent corona points, the emission curve gradually starts to flatten out.
This behaviour is often referred to as the “self-limiting mechanism” of corona. In case of the hydrophilic conductor, fewer drops adhere to the conductor. Therefore, the mutual shielding is less pronounced and higher levels of corona activity and audible noise emissions can be attained for surface gradients exceeding the intersection field strength. This behaviour is also reflected in A’∞ in Tab. 1. The differences occurring between the two investigated rain rates are caused by a similar interaction between the density of adhering water drops and resulting mutual shielding.
Two major conclusions regarding OHL design are to be drawn from the intersecting noise emission behaviours of untreated and treated (hydrophilic) conductors. First, it ought to be avoided to operate an overhead line close or even above the intersection surface gradient EI, since paradoxical emission behaviour regarding the influence of the rain rate as well as the conductor hydrophilicity can be expected. For excessive surface gradients, a line might even get louder when it ages. Secondly, if conductors with artificial hydrophilic properties are to be used for an OHL, their noise reducing properties can only be harnessed fully when the surface gradient is sufficiently low. For high surface gradients, hydrophilic conductors will yield only little effect.
Existing prediction models do not distinguish between standard (untreated) and hydrophilic conductors. This is reflected in the prediction curve shown in Fig. 8, which was calculated with the EPRI prediction model. The calculated values lie between those of the untreated and those of the treated conductors. This is consistent with the literature in that it states that the prediction model applies to “moderately aged” conductors [8]. The most problematic aspect here is that neither the “best case” nor the “worst case” are covered properly.
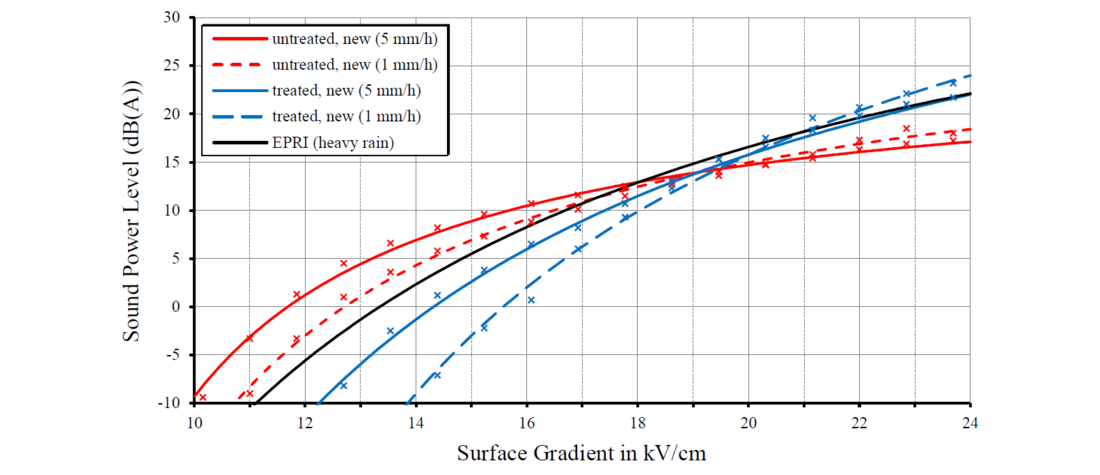
Figure 8 - Measurement results for Totara conductors with untreated as well as treated surfaces arranged in a horizontal twin-bundle configuration (bundle spacing 400 mm) at rain rates of 5 mm/h and 1 mm/h and EPRI prediction for this conductor at 6.5 mm/h (heavy rain)
Fig. 9 illustrates the problem presented in Section 4 with regard to significant noise levels at VLRR. For this purpose, the surface gradient dependent noise emission behaviour of several untreated and treated conductors was investigated at different rainfall rates. The tests confirmed the behaviour observed in connection with VLRR. In all cases, the noise levels occurring at a precipitation rate of 5 mm/h were exceeded at very low rain rates. The highest noise emissions were observed with the untreated single Araucaria conductor, which was also used for the overhead line in the case study in Section 4. The already existing overhead line towers limited the range of alternative conductors or bundle geometries to remedy the noise problem. However, the laboratory tests showed that a twin conductor bundle with Upas conductors provides a significant noise reduction.
If Upas conductors with hydrophilic surface treatment are used, the achievable noise reduction is around 8 dB(A). It should be noted that due to the modified geometry the operating surface gradient increases slightly when using Upas conductors. The surface gradients of the individual conductor bundles, which can be used to apply the laboratory results to the real overhead line, are summarized in Tab 2.
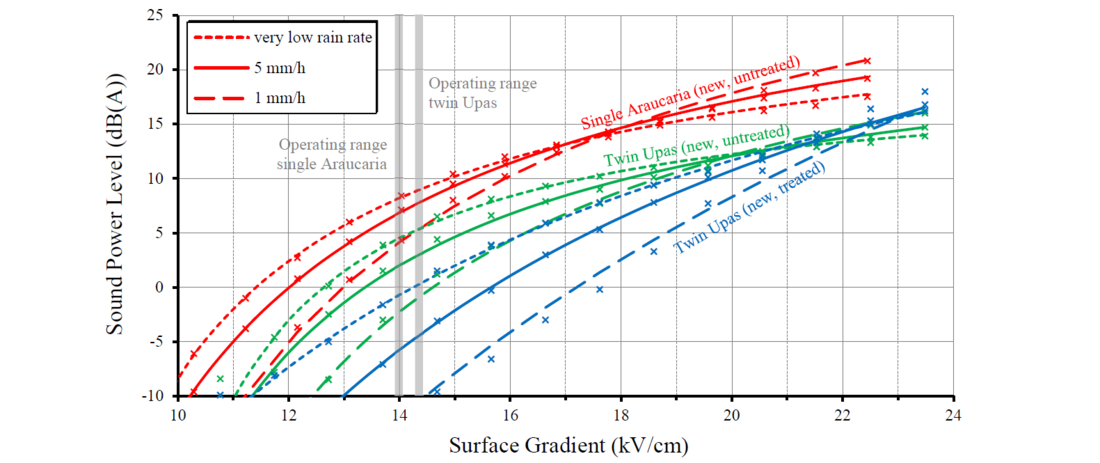
Figure 9 - Measurement results for single untreated conductor Araucaria, twin bundle untreated Upas conductor and twin bundle treated Upas Conductor

Table 2 - Tower geometry and surface gradients for OHL from case study (Section 4)
6. Conclusions
The starting point for the presented investigations was the phenomenon of high levels of corona-induced noise observed on an overhead line at very low rainfall rates. In order to find a remedy for this problem, laboratory tests were carried out in which the described behaviour was successfully reproduced. Both the evaluation of the noise measurements carried out on the affected overhead line with the aid of a disdrometer as well as the laboratory tests indicate that traditional noise prediction formulas do not adequately reflect the behaviour at very low rain rates. The measurements also showed that the predicted values are between the emission values to be expected according to the laboratory tests for conductors with and without surface treatment. Thus, neither of these two extreme cases is covered correctly. More detailed noise predictions, which take into account very low rainfall rates as well as the conductor surface, can be obtained using the values collected in laboratory tests. So far, however, individual measurements are necessary for each conductor type. The next goal is therefore to develop a comprehensive prediction model. To achieve this, further field measurements on overhead lines and additional laboratory tests are planned.
Acknowledgments
The authors wish to recognise the contributions made by Hannah Susorney and her colleagues at the United Kingdom Meteorological Office who provided invaluable contribution to the development of the physical parameters associated with very low rain rates.
References
- National Grid ESO: “Pathway to 2030”, National Grid ESO, Warwick, 2022: “A vision for Scotland’s electricity and gas networks”, online, accessed on 07.01.2024, 2022.
- Scottish and Southern Electricity Networks Transmission: “Projects delivering a Network for Net Zero Pathway to 2030”, online, accessed on 24.05.2023, 2023.
- Scottish Government: “A vision for Scotland’s electricity and gas networks”, online, visited on 07.01.2024.
- Scottish and Southern Electricity Networks Transmission: “Connecting UK consumers and communities”, online, accessed on 07.01.2024, 2024.
- E. R. Taylor, V. L. Chartier, and D. N. Rice: “Audible Noise and Visual Corona from HV and EHV Transmission Lines and Substation Conductors – Laboratory Tests”, IEEE Transactions on Power Apparatus and Systems, Vol. PAS-88(5), pp. 666 – 679, 1969.
- O. Pischler, U. Schichler, B. Zhang: “Interaction of Surface Gradient, Precipitation Rate and Conductor Surface Treatment on Corona Induced Audible Noise of AC Overhead Transmission Lines”, IEEE International Conference on High Voltage Engineering and Application (ICHVE), Beijing, People’s Republic of China, 2020.
- J. G. Anderson, J. R. Doyle, E. J. O’Brien: “Project UHV – Construction and Technical Plan”, IEEE Transactions on Power Apparatus and Systems, Vol. 91, No. 1, pp. 204 – 211, 1972.
- Electric Power Research Institute: ”EPRI Transmission Line Reference Book 345 kV and Above“, Second Edition, Palo Alto, United States, 1982.
- J. R. Booker: “Natural Aging of Non-Energized Aluminium Conductors”, IEEE Transactions on Power Delivery, Vol. 1, No. 4, pp. 269–274, 1986.
- J. Raniga, M. Walker, R. Urban, A. Lapthorn, S. Hardie: ”Audible Noise Management of Newly Reconductered Transmission Lines“, CIGRE Session Paris, Report B2-305, Paris, France, 2020.
- R. G. Houlgate, A. M. Clark, R. A. Stone: ”Method for Assessing the Community Response to Overhead Line Noise“, online, accessed on 01.09.2020, 1993.
- J. Lundquist: ”Methods for Predicting AC Transmission Line Audible Noise by Short-Term Single-Phase Tests“, IEEE Transactions on Power Apparatus and Systems, Vol. 103, No. 2, pp. 283–293, 1984.
- D. Khoury, M. Millet, Y. Jabali, O. Delhomme: “Fog Water: A General Review of Its Physical and Chemical Aspects”, Environments, Vol.10, No 12:224, 2023.
- American Meteorological Society: “Drizzle”, Glossary of Meteorology, online, accessed on 27.01.2024, 2023.
- J. A. Day: “Encyclopedia of Hydrology and Lakes”. Springer, Dordrecht, Netherlands, 1998.
- S. S. Muhammad, B. Flecker, E. Leitgeb, M. Gebhart: “Characterization of fog attenuation in terrestrial free space optical links”, Optical Engineering, Vol. 46, No. 6, 2007.
- Scottish Government: “Environmental Impact Assessment (EIA)”, online, accessed on 26.01.2024, 2023.
- National Grid plc: “TGN(E)_322 – Operational Audible Noise Assessment Process for Overhead Lines (New build, Reconductoring, Diversion and Uprating)”, 2021.
- The British Standards Institution: “BS 4142:2014+A1:2019 – Methods for rating and assessing industrial and commercial sound”, 2019.

