C1 - Flexibility from electric vehicles - residential charging coincidence factors in Norway
Authors
Aurora OPSTAD, Bjørn Harald BAKKEN, Gerard DOORMAN - Statnett, Norway
Heidi S. NYGÅRD - Norwegian University of Life Sciences, Norway
Kristian SEVDARI - Technical University of Denmark -DTU/ Statnett, Denmark

Summary
The increasing integration of renewable energy sources (RES) and the surge in e-mobility present challenges for the electrical power grid. This study, centered on residential charging in Norway, aims to understand charging coincidence factors (CF), analyze charging behavior, and evaluate the potential flexibility's implications on the power system. The investigation uncovered correlations between time, economic incentives, weather, and CF for residential charging. Smart residential customers demonstrated reduced evening peak charging demand, shifting it to off-peak hours. The negative correlation between CF and temperature was established. Additionally, depending on the size of the national vehicle fleet, synchronization in smart charging processes could lead to a substantial increase (up to 5.5 GW) of instantaneous power from EV charging. Moreover, we introduce the flexibility ratio concept for the charging session. Flexibility ratio accounts for the energy rapport between idle and charging time. A flexibility provider would better spread the charging time to reduce idle time and use the idle time to provide flexibility. For 2023 (or around 675 000 vehicles) in an eight-hour window, a minimum 115% flexibility ratio allows distribution of 14% (21-74 MWh/h) in each hour or a maximum of 178-588 MWh/h in two consecutive hours. In addition, for the 2.9 million scenario, an eight-hour window with a 115% flexibility ratio corresponds to 93.8-316 MWh/h each hour or a maximum of 763.8-2,505 MWh/h in two consecutive hours. The potential flexibility and optimized smart charging demand provide benefits for the power grid by reducing peak demand. However, future work should delve into understanding the implications of transmission system demand optimization and the loading impacts on the distribution system.
Keywords
Coincidence factor, Electric vehicles, Flexibility, Smart charging1. Introduction
The increased penetration of renewable energy sources (RES) and e-mobility can challenge the operation of the electrical power grid [1]. The former challenges the stability of the power system, due to the lack of inertia and the intermittency of such weather dependent sources [2]. The latter can be summarized into energy, and instantaneous power requirements [3]. While energy needs of e-mobility are not a problem [4], the instantaneous power can become a tall challenge to the power system [5]. Following this, on the power system balance challenge, the reduced controllability on generation side can be compensated with flexibility from the demand side, such as the charging process of electric vehicles (EVs) [6]. Moreover, the distribution grids face common challenges such as grid congestion [7] and voltage stability [8]. Subsequently, automation combined with market synchronization can exacerbate such challenges by creating avalanche and rebound effects [7], [9]. Therefore, utilizing demand side flexibility is seen as a valuable solution for the integration of RES and mitigating the challenges from transport electrification [10]. Previous investigations have pointed out the economic and environmental benefits of active integration of EVs’ into power grids [11]. Benefits of utilizing flexibility can summarized as i) better utilization of RES [12], ii) cost reduction in power grid planning [13] and operation [14], iii) reduced CO2 emissions [15] , and iv) electricity cost reduction for the end-user [16]. To date, slow charging (up to 22 kW) is by far the most widely used type of infrastructure for public and private charging sessions [17]. Here, slow charging correlates with long vehicle parking times, allowing for better accommodation for the charging demand in combination with the restrictions of the power grid [18]. However, the EV AC charging coincidence factor (CF), due to lack of data, has barely been investigated [19], [20]. CF is the variable that quantifies the ratio of EV fleet charging compared to the total available fleet. CF of EV charging can reflect a normal (dumb) or smart behavior. Authors of [20] highlight that normal domestic CF is affected by: i) size of the EV fleet considered, ii) pool of EV models and battery size in the EV fleet, iii) charger power, and iv) driving patterns. The importance of CF in calculating the foreseen power demand is highlighted from authors at [21]. For example, depending on the level of penetration of EVs in the society, impact of cost-based smart charging can be positive or negative [21]. Positive as it shifts the charging demand outside common peak hours (18:00-21:00), hence increasing grid capacity headroom. However, the mass synchronization with electricity price, if left as of today, can create up to 500% peaks of the current distribution grid transformer capacity affecting the low and medium voltage level [21].
This paper is focused on residential EV charging which is the dominating form of charging in Norway. First, it contributes to better understand residential charging CF by presenting the correlations with v) temperature and seasonality, vi) time of the day, vii) day and time of the week. Subsequently, a comparison between normal and smart charging behaviour is performed. Second, the paper presents charging behavior results from the residential customers of one of the energy suppliers in Norway. This is important to calculate the potential flexibility in the charging session. Third, the article combines the learning from CF and charging session flexibility to understand the implications of charging demand on the Norwegian power system. The implications from such investigation are of paramount importance for: i) grid operators to understand future EV charging behaviour, ii) commercial aggregators to better forecast their portfolio consumption, and iii) market players and system operators to better understand the potential of flexibility from residential EV charging. The remainder of the article is structured as follows. Section 2 presents the investigation workflow and data analysis process. Section 3 presents the factors influencing the residential charging CF. Section 4 investigates the implications of EV charging in Norwegian power system and the subsequent section 5 calculates the residential charging flexibility potential. Finally, section 6 concludes the article with the main findings.
2. Methodology
Norway is a leader in terms of the adoption of electric mobility. Hence, it serves as a testbed for the future implications of e-mobility. This is the case with the charging of EVs. The investigation analyses a data set of 216 households owning a Tesla EV and a smart electric vehicle supply equipment (EVSE), also referred as smart charger, that is remotely controlled to minimize the cost for consumers using an hourly electricity tariff. The data run from November 2020 to March 2021 and covers customers from all five Norwegian price zones that display both normal and smart charging behavior. Figure 1 describes the behavior of a representative customer from the dataset. Notably, the customer can change status from normal to smart. This is due to non-binding agreements between the energy supplier and endcustomer. Thus, the investigation takes under consideration the change in behavior. Furthermore, the followed methodology for this investigation is visualized at Figure 2. The end-goal is to understand the flexibility in residential smart charging operation and possible implications from instantaneous charging power demand. Consequently, this is achieved by extracting and analyzing patterns from the dataset in relation to factors influencing human behavior. Finally, the results are used to simulate the large-scale and future Norwegian EV scenarios.
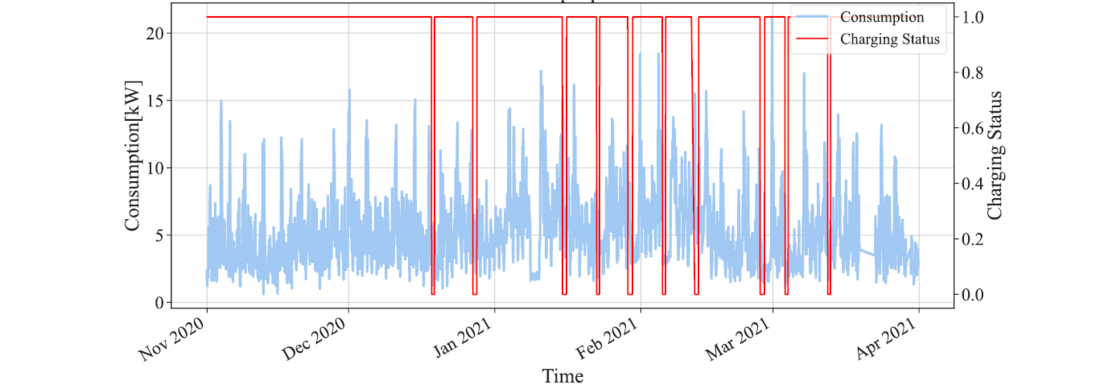
Figure 1 - A representative customer behavior from the dataset. Charging status “1” means smart and “0” normal charging
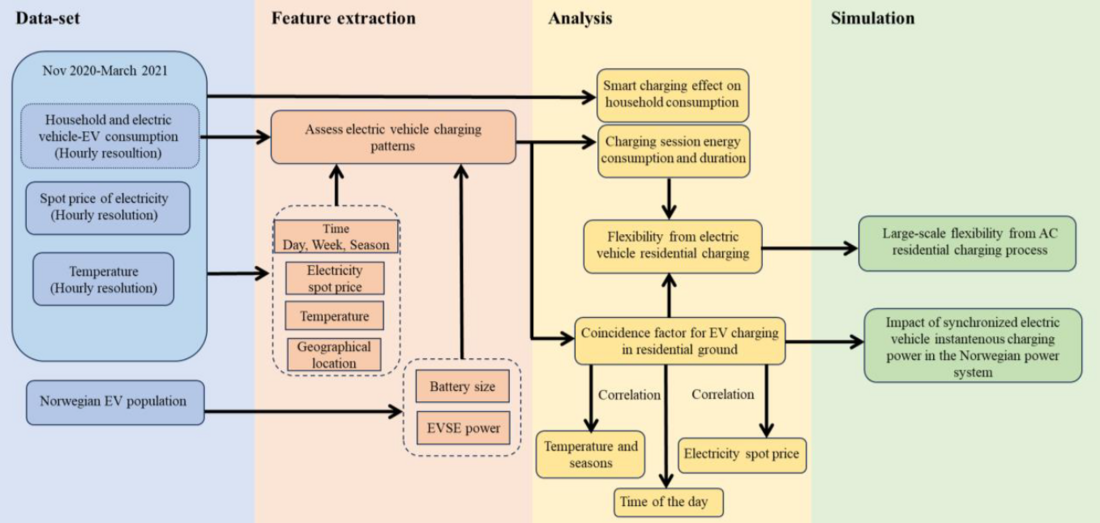
Figure 2 - Methodology and investigation workflow
3. Factors influencing charging coincidence factor
This section explains the factors affecting the human smart charging behavior. Previous investigation highlighted a correlation between the increase in the number of EVs in the fleet and the reduction of CF [20]. In addition, our data analysis in Norway suggest that CF is influenced even by i) geographical location (flat, hilly or mountainous terrain), ii) time, iii) economic incentives, and iv) weather. First, the terrain influences the consumption of the EV fleet, where a more mountainous terrain would consume more energy than a flat terrain. This can be seen by comparing the average energy delivered per session in Norway (22.5 kWh) and Denmark (17 kWh). On average, from the available data, EV users in both countries drive similar daily distance. Second, Figure 3 presents the hourly statistics of charging CF of normal, and smart customers from the energy supplier’s data in Norway. The boxplots show the distribution of CF during the day and during the week. The first row displays the CF distribution over the course of a day and a week of customers who use the energy supplier’s smart charging strategy. The second row shows the CF distribution over the course of a day and a week from the customers with normal charging. The calculated normal charging CF in residential ground indicates more connected vehicles during the evening and night. However, the distribution values are below 15% and hour 02:00 has the highest value as an outlier at 13%. Consequently, Friday is the day with the highest simultaneous charging sessions for normal customers. This can be explained with a common behavior of charging before weekend trips. In comparison, residential customers with smart charging behavior exacerbate the charging CF during evening and nighttime. The charging CF at hour 02:00 can reach 32%. Similar to normal charging, Friday is again the day with the highest simultaneous charging events for smart residential customers.
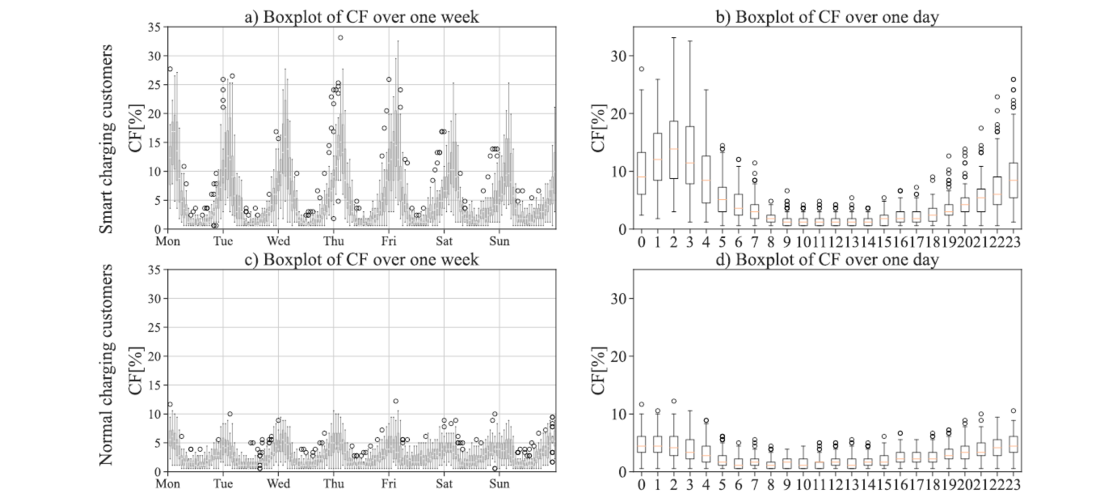
Figure 3 - Boxplot of coincidence factor for: smart charging customers aggregated in a week a) and a day b), normal charging customer aggregated in a week c) and a day d)
Third, notably, smart customers are economically motivated to synchronize their charging behavior with periods of lower electricity prices. The Norwegian households’ demand side response to variable hourly electricity prices is proven to reduce consumption, on average, 2.92% in hours with high prices [22]. Figure 4 (left) gives a clear view of how smart customers shift their electricity consumption towards hours with cheaper electricity prices. The graph presents the normalized average index for electricity consumption. For example, the smart customer reduces, on average, by 20% the charging demand during evening peak (17:00-20:00). Consequently, this reduced demand from the smart customer is fulfilled during night hours (00:00-3:00) when the demand increases compared to a normal customer. In addition, Figure 4 (right) presents a statistical representation of electricity consumption for smart and normal charging customers. Here, it is important to observe the consumption patterns, which are similar to Figure 4 (left). For instance, normal customers have significantly lower consumption during night hours compared to peak hours. While smart customers have a more balanced consumption during night and peak hours. Moreover, it is well-known the correlation of electricity demand with weather variables, or as known as demand elasticity [23], [24]. In a similar way, there exists a negative correlation between charging CF and temperature. During the cold season, there is a higher demand for charging energy. Consequently, there are longer and more frequent charging sessions. To illustrate, one can observe the change in CF from February to March in Figure 5. Colder temperatures correlate with larger CF and as soon as the temperature rises to above zero, the value of CF reduces. The Pearson correlation coefficient is – 0.30. Although the data do not stretch into the summer period, a similar behavior towards a second peak of energy demand is expected. However, the effect in the colder season should be significantly higher. As a final point, the normal residential charging behavior does not extend over 15% CF.

Figure 5 - The evolution of CF in relation to temperature
On the contrary, smart residential charging CF can reach up to 32% due to electricity price synchronization. In the light of such discovery, it is important to investigate if the synchronization of large fleets can challenge the operation of the power grid.
4. Charging implications
Previous studies have highlighted the challenge of headroom for EV charging process in the distribution grids [5], [7]. While for the transmission grid, currently large-scale charging is not problematic and presents new opportunities [12]. However, there is a lack of detailed analysis on the national power demand connected with human behavior. Hence, in our study we calculate the power demand from the 50 most sold EV models in each Norwegian municipality and subsequently aggregate in the price zones (NO1 to NO5). The EV fleet in Norway accounts for 675 398 vehicles by end of 2023 [25]. The Norwegian low-voltage electrical system is an isolated transformer (IT) system. The entire EV fleet can be clustered into four types (single, two and three-phase charging) as presented in Table I. The entire Norwegian EV fleet (50 EV models) charging demand is calculated based on the IT system formula. Further, we calculate the charging power demand for four charging CF scenarios (8, 15, 30 and 50 %) with seven different fleet numbers (from 675 398 to fully electrified Norwegian society with 2.9 mill EVs). Consequently, we assume that every customer in Norway will participate in smart charging applications. Figure 6 illustrates the geographical share of EV population and the potential peak charging demand in MW for a 30 % charging CF scenario when considering 675 398 EVs with a smart charging behavior. Subsequently, a 30 % charging CF accounts for a power demand of 1.3 GW nationally or, 497.71 MW (NO1), 391.9 MW (NO2), 185.5 MW (NO3), 66.62 MW (NO4) and 164.6 MW (NO5).
| EV model | Share-national [%] | Total-national | Charging current [A] | Charging power [kW] |
|---|---|---|---|---|
| Nissan LEAF | 10.41 | 70309 | 16/32 | 3.68/7.36 |
| VW Golf | 6.37 | 43023 | 16 | 5.2 |
| Tesla Model Y | 6.29 | 42.483 | 16 | 6.37 |
| Renault Zoe | 2.07 | 13981 | 16/32 | 6.37/12.75 |
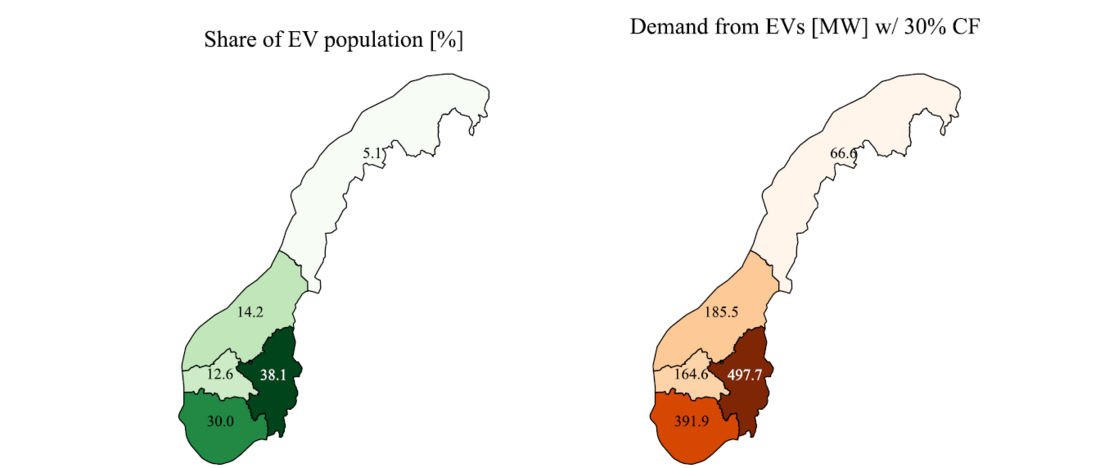
Figure 6 - (left) Distribution of EVs in Norway and (right) active power demand with a 30% CF according to electricity price zones for 675 398 vehicles
Figure 7 calculates the AC charging instantaneous demand from up to 2.9 million EVs nationally for each of the Norwegian price zones. Continuing with the 30 % charging CF power demand, the 1, 2 or 2.9 million EV scenarios would require 1.9, 3.8 or 5.5 GW of instantaneous power, respectively. On relative terms with the current peak demand (23.86 GW), the numbers correspond to 7.9, 15.9 or 23 % increase in power demand from EV charging in Norway. Generally, the grid planning and infrastructure upgrade process accounts for the peak demand scenarios. Two peak consumption case scenarios are presented in Figure 8. Each price zone and Norway as whole are investigated regarding the possible peak consumption. Here, the “new peak consumption” accounts for the current peak consumption and added EV charging consumption from normal and smart charging with the CF presented in Figure 3. On the one hand, the “electricity demand today” represents the scenario with current peak consumption and current number of EVs (675 398). On the other hand, the “electricity demand future” represents the scenario with current peak consumption and complete penetration of EVs (2.9 million). If everyone in Norway, today, is participating in smart charging applications, there are benefits on reducing the electricity demand in evening hours when compared to normal charging. However, the shifted demand creates a new even higher peak consumption during the morning hours. That comes due to the significantly larger CF (synchronization of charging) experienced in smart charging when compared to normal charging. Hence, if the peak electricity consumption day corresponds with the smart charging behavior showcased by the customers, there will be a new even higher peak demand in morning hours. Consequently, it will require new power grid upgrades to cover the new morning peak demand.

Figure 7 - Charging instantaneous demand for four charging CF scenarios
The future scenario exaggerates even more the consequences of smart charging synchronization. Subsequently, the early night hours that might experience a CF between 25-30 % can create a new record peak demand of over 25.7 GW for Norway. To better optimize power grid operation and investments, smart charging demand should not overshoot that of the peak normal charging demand. The normal charging demand should serve as a baseline to be improved by smart charging. Thus, a better optimized smart charging should account for such large-scale demand synchronization and mitigate the risks.
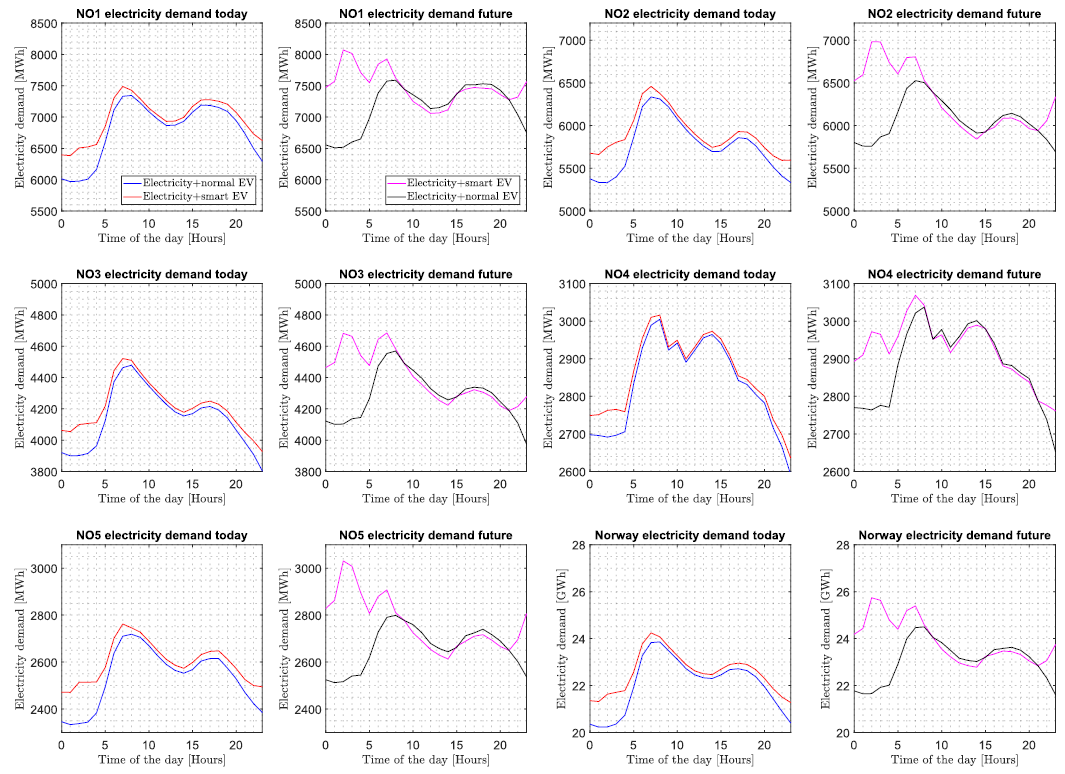
Figure 8 - The highest electricity consumption day of each Norwegian price zones combined with EV normal and smart demand
Table II provides a more detailed view on the impact of EV charging demand in Norway for the worst day. The average electricity consumption is the unavoidable figure that the power grid needs to supply. However, the power network is built to supply the maximum demand during the entire time. Hence, reducing the maximum instantaneous power demand mitigates power grid upgrade investments. For the “today scenario”, a full penetration of smart charging adds a 200 MW load to the average hourly or 180 MW to the maximum consumption of the worst day due to a higher synchronization. Following this, the maximum consumption for smart charging for “today” and “future” scenarios can serve as a baseline for quantifying the benefits of flexibility in reducing the power grid upgrade investments.
| Today: NO with normal charging | Today: NO with smart charging | Today: NO with normal charging | Today: NO with smart charging | ||||
|---|---|---|---|---|---|---|---|
| (average) [GWh/h] | (max) [GWh/h] | (average) [GWh/h] | (max) [GWh/h] | (average) [GWh/h] | (max) [GWh/h] | (average) [GWh/h] | (max) {GWh/h] |
| 22.03 | 23.86 | 22.23 | 24.04 | 23.04 | 24.49 | 23.88 | 25.73 |
The Norwegian case differs from other European countries due to consumption pattern peaking at the morning hours. Thus, smart charging would be beneficial to not overload the grid during morning hours in comparison to the usual evening peak hours experienced in other European countries.

5. Flexibility
In this paper, the term flexibility is used to describe the ability to adjust power demand, without compromising comfort, for the benefit of the power grid. Hence, the flexibility can be beneficial in planning and operation. The former can employ flexibility to postpone or avoid grid upgrades. The latter can utilise flexibility as reserve capacities to balance the power grid operation. However, to better understand the possibility of delivering flexibility from the EV charging process, it is necessary to investigate the statistics of the charging sessions. Figure 9 provides a comprehensive view of energy delivered and session duration for the energy supplier’s smart customers in each Norwegian price zone.
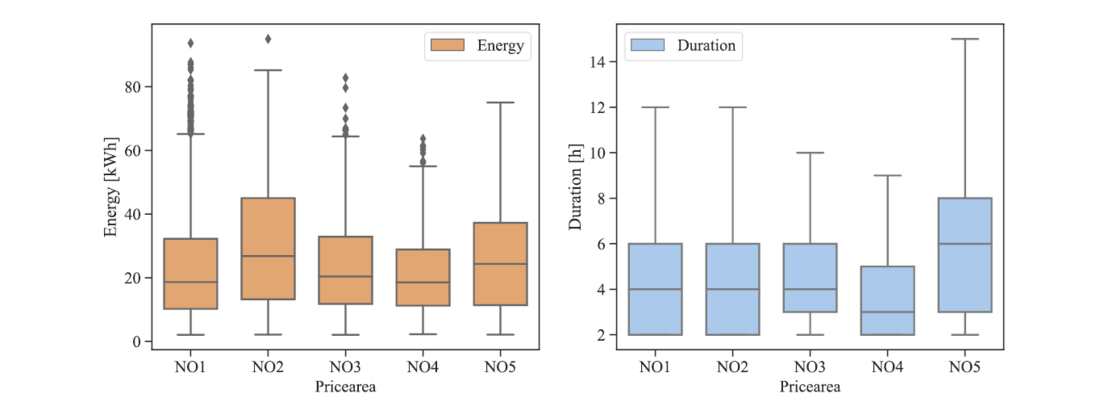
Figure 9. Statistics (boxplot) of charging session energy delivery and duration for the five Norwegian price zones (NO1-NO5)
In addition, Table III summarizes the results and quantifies the flexibility ratio for each smart charging session in the Norwegian price zones. On average, EVs stay connected to an EVSE more than the time needed to deliver the required energy. Therefore, the flexibility ratio can be used to deliver flexibility to the power grid. Flexibility ratio accounts for the energy rapport between idle and charging time. Such flexibility can be distributed (modulation of charging power) or used once (scheduling ON/OFF of charging) over the entire connection period. For instance, a charging session at NO5 (Bergen region) has 57.7 % flexibility ration, that can be used to reduce with 10% (0.63 kW) the charging power over 5.93 hours or reduce with 57.7 % (3.67 kW) the charging power over 1 specific hour. However, charging modulation power range should be carefully decided due to the rebound effect on increasing onboard charger losses [26]. Additionally, Table III displays an average flexibility ratio for an assumed six- and eight-hour window session duration with charging power of 6.37 kW.
| Quantity of the session | NO1 | NO2 | NO3 | NO4 | NO5 |
|---|---|---|---|---|---|
| Avg. session duration [h] | 4.72 | 4.83 | 4.96 | 3.89 | 5.93 |
| Avg. session energy [kWh] | 22.68 | 29.94 | 23.41 | 20.93 | 25.6 |
| Avg. required time [h] | 3.03 | 4.24 | 3.3 | 2.9 | 3.61 |
| Avg. flexible energy [kWh] | 10.76 | 3.76 | 10.57 | 6.3 | 14.78 |
| Avg. flexibility ratio | 47% | 12.5% | 45% | 30% | 57.7% |
| Assumed avg. flexibility ratio for 6 hours | 75.8% | 37.4% | 73.4% | 94% | 59.4% |
| Assumed avg. flexibility ratio for 8 hours | 139% | 80% | 127% | 138% | 109% |
Following this, a conservative national estimation suggests at least 36.8 % flexibility ratio for the charging process in a four-hour nighttime window. If the assumption takes into consideration that EVs stay connected to an EVSE for longer than four hours, e.g. six hours, the flexibility ratio increases to at least 62 %. Meaning that during the six-hour connected period there is at least 10 % flexibility for the connected fleet (smart) of EVs or 38-50 MWh/h in each hour. Additionally, the maximum flexibility restricted to 1 hour in a six-hour window would be from 228-318 MWh/h. For an eight-hour window there is at least 115 % flexibility ratio that can distributed 14 % (21-74 MWh/h) in each hour or a maximum of 178-588 MWh/h in two consecutive hours. Furthermore, for the 2.9 mil scenario an eight-hour window 115 % flexibility ratio means 93.8-316 MWh/h each hour or a maximum of 763.8-2 505 MWh/h in two consecutive hours. This paper highlighted that full smart charging penetration could elevate daytime demand peaks, especially considering the peak period in the morning hours in Norway. However, an optimization problem has been formed to calculate the possibility of reducing the peak demand. The decision variables are 𝑥1,𝑥2,…,𝑥24, representing the consumption values for each hour. The optimization problem can be mathematically represented as follows:
subject to:
(Eq. 1)
The optimization finds a better load curve (reducing the peak demand) by penalizing the 6-22 hours and trying to redistribute the EV load at night hours. The baseline is the demand curve with normal charging. The results can be distinguished in Figure 10. The objective is to minimize the red curve while maintaining the maximum allowed reduction (flexibility) for the blue curve. The blue curve represents the current Norwegian consumption with normal charging. Figure 10 (a) showcase how a three-hour EV charging demand shift can reduce the morning peak with 413 MW matching the demand from normal charging. Instead, Figure 10 (b) presents the possibility to further reduce the electricity consumption during the day (less than 80 MW) and lowering the peak demand with 80 MW by shifting the charging process during the night hours. This optimization proves that smart charging can reduce the peak demand even with higher CF by utilizing charging session flexibility or incentivizing users via tariffs to shift their demand. Further, Figure 10 (c) looks at the optimized demand with the same peak as the normal demand (blue line). Hence, the demand with smart charging (red line) can be optimized to not overshot the peak of electricity demand with normal charging (blue line). In addition, Figure 10 (d) showcases the result (yellow line) of optimizing the smart charging demand (red line) to further reduce with 300 MW the peak of electricity demand with normal charging (blue line). The solution lies in better incentivizing the night hours charging and displays the opportunities of smart charging.
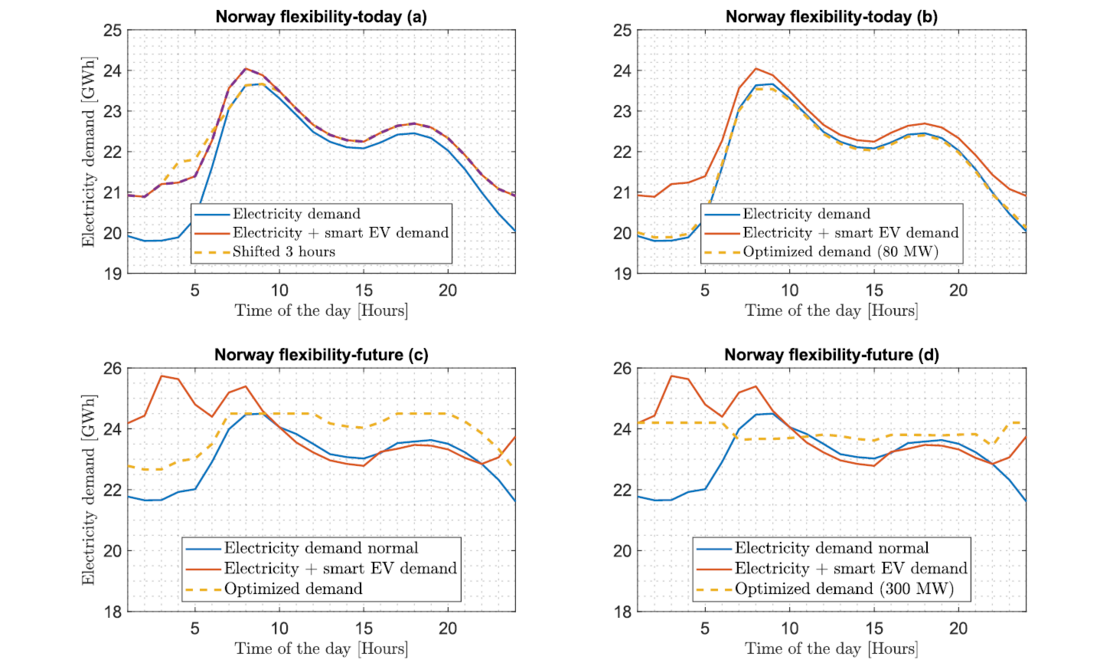
Figure 10 - Optimization results of the smart charging demand to reduce the maximum demand and avoid power grid upgrades
6. Conclusions
This paper presented the results of residential smart charging behavior in Norway. The study uncovered the correlation of i) time, ii) economic incentives, and iii) temperature with the charging coincidence factor (CF). For customers with normal charging behavior, Friday is the day with the highest simultaneous charging sessions. While for the daily patterns, the values of CF are below 15 % and hour 02:00 has the highest value at 13 %. Similarly, Friday is the day with the highest simultaneous charging events for residential customers with smart charging. Subsequently, smart charging behavior can experience 32 % charging CF at hour 02:00.
Moreover, there is a clear correlation between smart charging and electricity prices. For example, customers with smart charging reduce, on average, by 20% the charging demand during evening peak (17:00-20:00). Consequently, this reduced demand is fulfilled during night hours (00:00-3:00) when the demand increases compared to a customer with normal behavior. Lastly, the charging CF has a negative correlation with temperature. Lower temperatures increase the charging CF.
Additionally, this paper analyzed the demand impact from behavior synchronization for a full penetration of smart charging. For instance, considering the 2023 electricity demand, the Norwegian peak including normal charging reached 23.86 GWh/h, while the peak demand with full penetration of smart charging can reach 24.04 GWh/h. Similarly, the scenario with 2.9 million EVs can experience 24.49 GWh/h and 25.73 GWh/h for normal and smart charging scenarios, respectively. Continuing with the 30 % charging CF, the 1, 2 or 2.9 million EV scenarios would require 1.9, 3.8 or 5.5 GW of instantaneous power, each. On relative terms with the current peak demand (23.86 GW), the numbers correspond to 7.9, 15.9 or 23 % increase in power demand from EV charging in Norway.
Therefore, a better approach should be implemented for smart charging processes to avoid demand synchronization. The charging process embeds flexibility due to the larger connected time compared to the time needed to deliver the required energy. A conservative estimate indicates a minimum 36.8 % flexibility ratio for national charging processes (670 000 vehicles) during a four-hour nighttime window. If EVs stay connected to an EVSE for six hours, the flexibility ratio increases to at least 62 %. For instance, in a six-hour period, there is a minimum 10 % flexibility (38-50 MWh/h) per hour, with a maximum flexibility of 228-318 MWh/h within a one-hour window. In an eight-hour window, a minimum 115% flexibility allows for distribution of 14% (21-74 MWh/h) in each hour or a maximum of 178-588 MWh/h in two consecutive hours. For the 2.9 million scenario, the same flexibility ratio corresponds to 93.8-316 MWh/h each hour or a maximum of 763.8-2,505 MWh/h in two consecutive hours. The flexibility and a better, optimized smart charging demand can be beneficial to the power grid by reducing the peak demand. Future work should focus on understanding the implications of transmission system demand optimization and distribution system loading implications.
References
- B. Mohandes, M. S. El Moursi, N. Hatziargyriou, and S. El Khatib, “A Review of Power System Flexibility with High Penetration of Renewables,” IEEE Trans. Power Syst., vol. 34, no. 4, pp. 3140–3155, 2019, doi: 10.1109/TPWRS.2019.2897727.
- F. Milano, F. Dorfler, G. Hug, D. J. Hill, and G. Verbič, “Foundations and challenges of low-inertia systems (Invited Paper),” 20th Power Syst. Comput. Conf. PSCC 2018, pp. 1–25, 2018, doi: 10.23919/PSCC.2018.8450880.
- K. Sevdari, L. Calearo, P. B. Andersen, and M. Marinelli, “Ancillary services and electric vehicles: An overview from charging clusters and chargers technology perspectives,” Renew. Sustain. Energy Rev., vol. 167, no. April, p. 112666, 2022, doi: 10.1016/j.rser.2022.112666.
- R. Lauvergne, Y. Perez, M. Françon, and A. Tejeda De La Cruz, “Integration of electric vehicles into transmission grids: A case study on generation adequacy in Europe in 2040,” Appl. Energy, vol. 326, no. September, 2022, doi: 10.1016/j.apenergy.2022.120030.
- L. Calearo, A. Thingvad, K. Suzuki, and M. Marinelli, “Grid Loading Due to EV Charging Profiles Based on Pseudo-Real Driving Pattern and User Behavior,” IEEE Trans. Transp. Electrif., vol. 5, no. 3, pp. 683–694, 2019, doi: 10.1109/TTE.2019.2921854.
- E. Lannoye et al., “Assessing Power System Flexibility for Variable Renewable Integration: A Flexibility Metric for Long-Term System Planning ‘Assessing power system flexibility for variable renewable integration: a flexibility metric for long-term system planning,’” CIGRE Sci. Eng., vol. 3, pp. 26–39, 2015.
- T. Unterluggauer, F. Hipolito, S. Klyapovskiy, and P. B. Andersen, “Impact of Electric Vehicle Charging Synchronization on the Urban Medium Voltage Power Distribution Network of Frederiksberg,” World Electr. Veh. J., vol. 13, no. 10, pp. 1–18, 2022, doi: 10.3390/wevj13100182.
- M. Neaimeh et al., “A probabilistic approach to combining smart meter and electric vehicle charging data to investigate distribution network impacts,” Appl. Energy, vol. 157, pp. 688–6982015, doi: 10.1016/j.apenergy.2015.01.144.
- M. Kühnbach, J. Stute, and A. L. Klingler, “Impacts of avalanche effects of price-optimized electric vehicle charging - Does demand response make it worse?,” Energy Strateg. Rev., vol. 34, p. 100608, 2021, doi: 10.1016/j.esr.2020.100608.
- M. Z. Degefa, I. B. Sperstad, and H. Sæle, “Comprehensive classifications and characterizations of power system flexibility resources,” Electr. Power Syst. Res., vol. 194, no. February, p. 107022, 2021, doi: 10.1016/j.epsr.2021.107022.
- F. Gonzalez Venegas, M. Petit, and Y. Perez, “Active integration of electric vehicles into distribution grids: Barriers and frameworks for flexibility services,” Renew. Sustain. Energy Rev., vol. 145, no. March, p. 111060, 2021, doi: 10.1016/j.rser.2021.111060.
- P. A. Gunkel, C. Bergaentzlé, I. Græsted Jensen, and F. Scheller, “From passive to active: Flexibility from electric vehicles in the context of transmission system development,” Appl. Energy, vol. 277, no. June, p. 115526, 2020, doi: 10.1016/j.apenergy.2020.115526.
- S. Klyapovskiy, S. You, A. Michiorri, G. Kariniotakis, and H. W. Bindner, “Incorporating flexibility options into distribution grid reinforcement planning: A techno-economic framework approach,” Appl. Energy, vol. 254, no. August, p. 113662, 2019, doi: 10.1016/j.apenergy.2019.113662.
- M. Resch, J. Buhler, B. Schachler, and A. Sumper, “Techno-Economic Assessment of Flexibility Options Versus Grid Expansion in Distribution Grids,” IEEE Trans. Power Syst., vol. 36, no. 5, pp. 3830–3839, 2021, doi: 10.1109/TPWRS.2021.3055457.
- M. H. Tveit, K. Sevdari, M. Marinelli, and L. Calearo, “Behind-the-Meter Residential Electric Vehicle Smart Charging Strategies: Danish Cases,” 2022 Int. Conf. Renew. Energies Smart Technol. REST 2022, 2022, doi: 10.1109/REST54687.2022.10022910.
- L. Calearo, C. Ziras, K. Sevdari, and M. Marinelli, “Comparison of Smart Charging and Battery Energy Storage System for a PV Prosumer with an EV,” 2021. doi: 10.1109/ISGTEurope52324.2021.9640120.
- M. Korpas et al., “Learning From the Norwegian Electric Vehicle Success: An Overview,” IEEE Power Energy Mag., vol. 21, no. 6, pp. 18–27, 2023, doi: 10.1109/MPE.2023.3308246
- L. Calearo, M. Marinelli, and C. Ziras, “A review of data sources for electric vehicle integration studies,” Renew. Sustain. Energy Rev., vol. 151, no. July, p. 111518, 2021, doi: 10.1016/j.rser.2021.111518.
- I. Safak Bayram, A. Saad, R. Sims, A. Babu, C. Edmunds, and S. Galloway, “Statistical Characterisation of Public AC EV Chargers in the UK,” IEEE Access, vol. 11, no. July, pp. 70274–70287, 2023, doi: 10.1109/ACCESS.2023.3293091.
- J. Bollerslev et al., “Coincidence Factors for Domestic EV Charging from Driving and Plug-In Behavior,” IEEE Trans. Transp. Electrif., vol. 8, no. 1, pp. 808–819, 2022, doi: 10.1109/TTE.2021.3088275.
- T. Unterluggauer, F. Hipolito, J. Rich, M. Marinelli, and P. B. Andersen, “Impact of cost-based smart electric vehicle charging on urban low voltage power distribution networks,” Sustain. Energy, Grids Networks, vol. 35, p. 101085, 2023, doi: 10.1016/j.segan.2023.101085.
- M. Hofmann and K. B. Lindberg, “Evidence of households’ demand flexibility in response to variable hourly electricity prices – Results from a comprehensive field experiment in Norway,” Energy Policy, vol. 184, no. October 2023, p. 113821, 2024, doi: 10.1016/j.enpol.2023.113821.
- K. Sevdari, A. Islami, E. Haxhiraj, and E. Voshtina, “A data-driven assessment of the electricity demand- the case of Albania,” in 2022 International Conference on Renewable Energies and Smart Technologies (REST), 2022, pp. 1–5.
- M. Bessec and J. Fouquau, “The non-linear link between electricity consumption and temperature in Europe: A threshold panel approach,” Energy Econ., vol. 30, no. 5, pp. 2705–2721, 2008, doi: 10.1016/j.eneco.2008.02.003.
- Norsk elbilforening, “Statistikk elbil,” 2023. Online (accessed Dec. 20, 2023).
- K. Sevdari, L. Calearo, B. H. Bakken, P. B. Andersen, and M. Marinelli, “Experimental validation of onboard electric vehicle chargers to improve the efficiency of smart charging operation,” Sustain. Energy Technol. Assessments, vol. 60, no. September, p. 103512, 2023, doi: 10.1016/j.seta.2023.103512.

