B3 - Seismic resilience of interconnected substation equipment: Lessons learned from a comprehensive test and modelling program
Authors
M. V. SIVASELVAN - University of Buffalo, USA
Leon KEMPNER Jr. - Bonneville Power Administration, USA

Summary
Vulnerability of substations in earthquake-prone areas can result in major power outages, severe economic loss, and disruption of post-earthquake response. Past earthquakes have exposed such vulnerability, prompting systematic research and leading to the development of recommended practices for seismic design of substation equipment (IEEE 693). Protective systems such as base isolation have also been deployed. Despite these advancements, some issues pertaining to seismic response of substations demand further attention, one of which is the influence of interconnection, particularly through flexible conductors.
This paper describes a comprehensive research program undertaken to characterize the role of interconnection by flexible conductors on seismic response of substation equipment. The research program consists of four components: 1 – Dynamic tests on individual, 2 – Full-scale interconnected system tests on an earthquake simulation, 3 – Computational modelling. 4 – Model-in-the-loop testing. Many findings reported in this paper are new, and have not been previously reported in either the seismic structural dynamics or substation systems literature.
Keywords
Flexible conductor dynamics, transformer bushing, parametric resonance, damping, mode shapes, multi-axis load cell, B-Spline, Model-in-the-loop1. Background, motivation and approach
Equipment in substations are often interconnected by a flexible buswork of conductors (see Figure 1). Such conductors are stranded cables (see Figure 2), but are of much shorter span (typically 6 – 25 ft/1.8 – 7.6m) compared to the more extensively studied transmission lines. Unlike long-span cables, in which the predominant internal force is tension, flexible-bus conductors have significant bending effects, thus ability to carry compression, and their mechanics are fundamentally different. Procedures for seismic qualification of substation equipment in the United States are described in the IEEE 693-2018 standard. These protocols are essentially for stand-alone equipment, and interaction is accounted for indirectly in Section 6.9, Annex A.1.6 of IEEE 693-2018 and Chapter 8 of IEEE 1527-2018 (Design of Buswork Located in Seismically Active Areas).
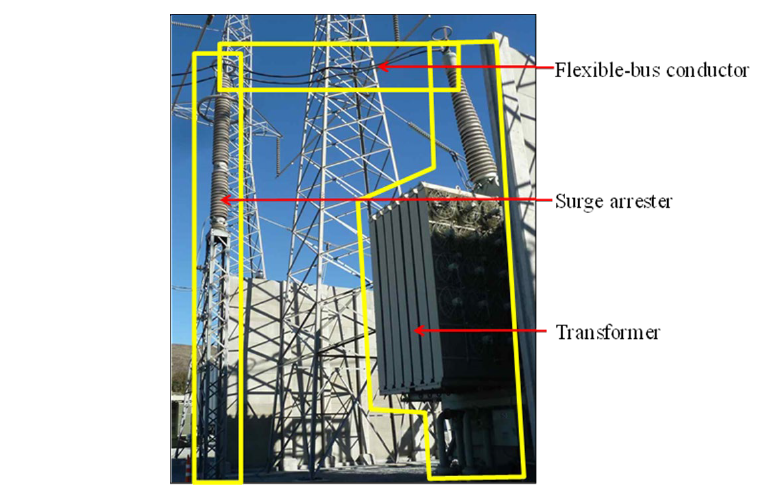
Figure 1 - Example of flexible conductor interconnecting substation equipment (Photograph by Anshel Schiff)
The IEEE Standards provisions are based on the premise that large opposing relative displacements between equipment could result in flexible conductors developing significant tension, even in the form of impacts, and hence excessive terminal loads and base moments in the equipment. The standards therefore provide guidance for (i) determining adequate slack in flexible conductors, and (ii) amplifying the base moment for which to qualify equipment to account for conductor loads.
The recommended adequate slack often conflicts with electrical clearances and conductor stability under ice and wind loads. The moment amplification factors need a foundation in principles of mechanics. Most importantly, our preliminary experiments on an earthquake simulator brought into question the premise that excessive conductor terminal loads resulted from large opposing relative displacements between equipment. These factors pointed to a clear need to better understand dynamics of equipment interconnected by flexible conductors, to address seismic response and resilience of substations.

Figure 2 - Name designations and cross-sections of common flexible conductor types (1in = 25.4mm)
This paper highlights tools that have been developed in this research that utilities can use to independently assess vulnerability due to interconnection by flexible conductors. It also summarized key pieces of new understanding that have been gained on the dynamic response of flexibly interconnected equipment. The remainder of this paper is organized as follows. Section 2 describes a nonlinear effect displayed by individual conductors subjected to dynamic excitation. How this effect plays into nonlinear dynamic phenomena at the interconnected system-level is presented in Sections 5 and 6. Prior to this, Section 3 summarizes full-scale shake table tests of interconnected equipment in a variety of configurations. A key finding from these tests, besides the nonlinear phenomena, is that there are well-defined patterns or mode in which interconnected systems respond, as discussed in Section 4. In particular, the response mode that causes opposing relative displacement of the conductor terminals (considered an important factor in the current standards) is highly damped, and is not substantially excited by ground motion. Section 7 provides an overview of the computational modelling component, describing a novel modelling approach, an example of comparison of computational results to experimental measurements, a case study on an interconnected system that, prior to this research, informed IEEE 1527, and a web-based interface to facilitate ready access to the tool. Section 8 presents the Model-in-the-loop framework. Finally, some important lessons learned are enumerated in Section 9.
2. Nonlinear dynamic effects in conductors – stability of in-plane configuration
Individual conductors of all the type shown in Figure 2 were tested dynamically. In each case, one end of the conductor is held fixed, and the other end is driven harmonically using uniaxial shaker as shown in Figure 3. Specially designed six degree-of-freedom load heads (see Figure 5 and reference [1] for details) are mounted at each end to measure the conductor terminal forces and moments. The slack in the conductor as well as the excitation amplitude and frequency are varied. It is observed, irrespectively of conductor type, and for each value of slack, for certain combinations excitation amplitude and frequency, the conductor exhibits significant out-of-plane response (often violent in nature), i.e., the in-plane configuration of the conductor becomes dynamically unstable. When this occurs, the frequency of the out-of-plane response occurs at progressively decreasing integer fractions of the exciting frequency (1/2, 1/3 etc.) eventually becoming aperiodic and chaotic. Details are presented in reference [3].

Figure 3 - Experimental setup for dynamic excitation of individual conductors
The phenomenon can be understood by considering a simplified representation of the conductor shown in Figure 4, consisting of two links. Out-of-plane response of the conductor is like the swinging of the pendulum. In-plane relative displacement between the ends of the conductor changes the length of this pendulum. Changing the length of the pendulum at certain frequencies causes the vertical equilibrium position of the pendulum to become unstable. The significance of this for system-level response is discussed in Section 6.

Figure 4 - Simplified representation of conductor to understand stability of in-plane configuration
3. Interconnected system configurations
Two interconnected system configurations, with components represented at full scale, were tested on an earthquake simulator [4] at the University at Buffalo, New York.
Configuration 1 – 230 kV transformer bushing-surge arrester interconnection
The base configuration, shown in Figure 6, consists of a 230 kV transformer bushing and a mock 230 kV surge arrester (designed to have representative dynamic properties). The bushing is mounted on a 3/8-in (9.53-mm) thick 8 ft×8 ft (2.44m×2.44m) cover plate bolted all around to a stiff support frame. The frame is fastened to the shake table platform. The surge arrester is bolted to a 24 in×24 in (0.61m×0.61m) steel plate that is 0.5-in (12.7-mm) thick. This plate is supported on a stiff pedestal mounted to the shake table platform. The pedestal is diagonally braced to minimize its contribution to the interconnected system dynamics. The support plate of the surge arrester is intended to represent the flexibility of the support structure in the field. The conductor terminals are at the same vertical elevation and the conductor forms a catenary geometry.
Different variations of the base configuration are made so that a wide variety of equipment dynamics and conductor configurations could be tested. (i) Conductor type: All five conductor types shown in Figure 2; (ii) Nominal conductor slack levels: The nominal conductor slack is defined per IEEE 1527 as the difference between the conductor length and the straight line distance between its attachment points. This slack is varied over a wide range – 12 in (20.5cm) , 9 in (22.9 cm), 7 in (17.8 cm), 5 in (12.7 cm), 4 in (10.2 cm), 3 (7.6 cm), 2 (5.1 cm), 1 in (2.5 cm) and 0 in (0 cm); (iii) Number of conductors: Single-conductor and double-conductor configurations; (iv) Stiffness properties of the bushing cover plate and surge arrester base plate; (v) Center of gravity and mass moment of inertia of the surge arrester.
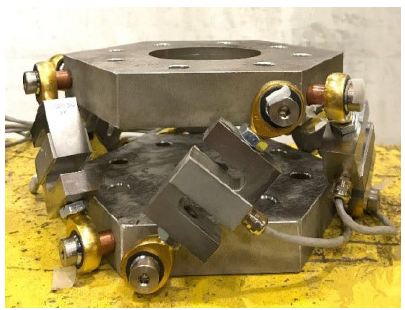
Figure 5 - 6-DOF load head to measure conductor terminal forces and moments [1]
Three acceleration components are measured at different locations over the heights of the bushing and surge arrester, as well as along the length of the conductor. Displacements are also measured at locations over the heights of the equipment. Load heads of the type in Figure 5 are sued to measure conductor terminal forces and moments at either end. The bases of the equipment are instrumented with strain gages to enable measuring the base moments directly. A 3D position tracking system is used with markers along the length of the length of the conductor, so that the displaced shape of the conductor can be reproduced at every instant of time. Details of the experimental process and data analysis can be found in reference [5].
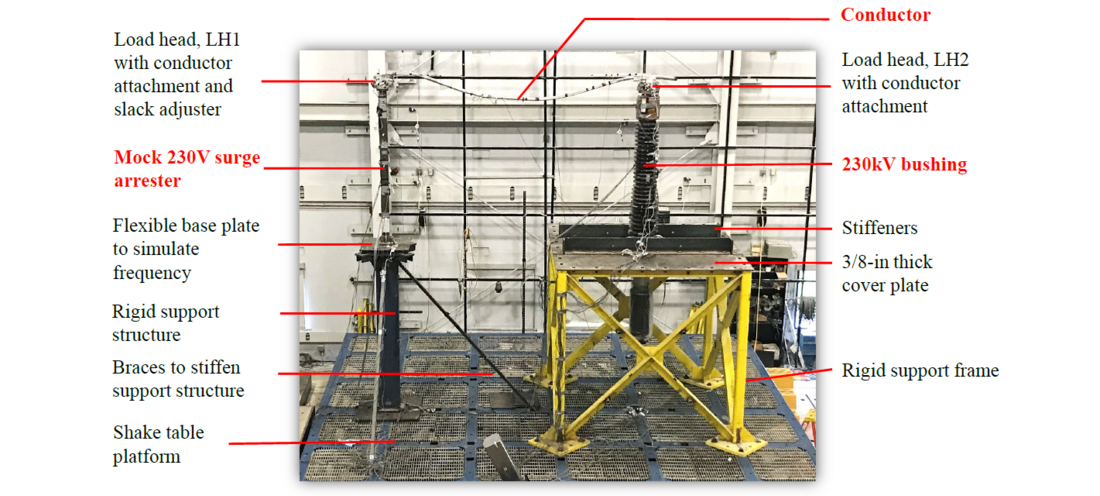
Figure 6 - 230 kV transformer bushing-surge arrester configuration
Configuration 2 – 230 kV circuit breaker-disconnect switch interconnection
This second test configuration, shown in Figure 7, consists of structures representing dynamic properties of a 230 kV dead tank circuit breaker and a 230 kV disconnect switch, and a one-phase bus connection. These properties were obtained based on modal analysis of measure data from shake table qualifications tests of an actual circuit breaker and an actual disconnect switch. Since the circuit break had composite insulators that are relatively light, modes involving deflections of the insulators had much higher frequencies. Therefore, the structure is designed to represent the tank mode of the circuit breaker, with the conductor connected at a 22-degree angle as shown in Figure 7. Unlike in the previous configuration, here the conductor terminals are at different elevations and angles, and the conductor takes on an inverted half-parabola geometry. Again, conductor type and span are varied. Instrumentation is similar to that described above.
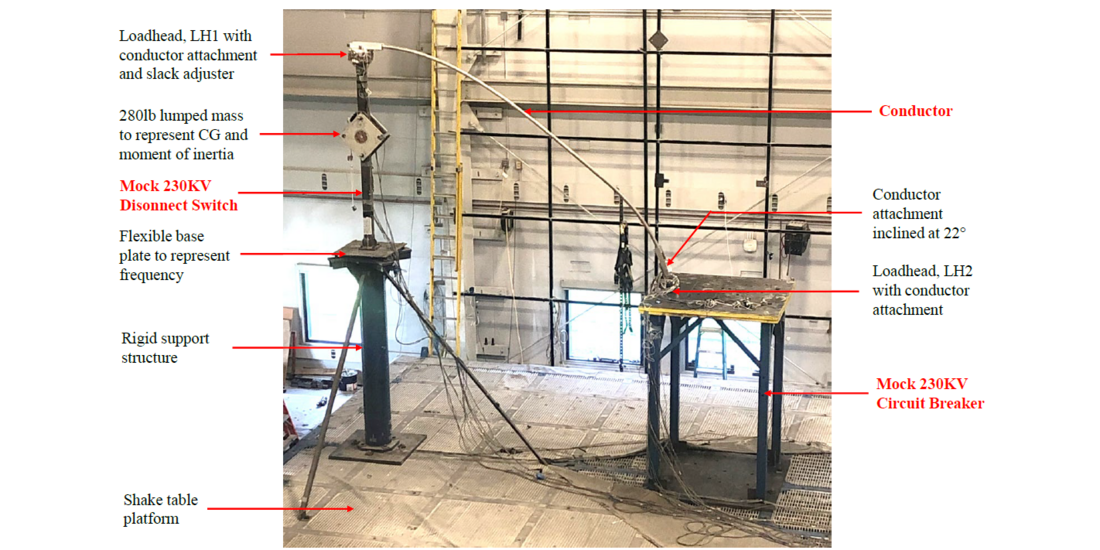
Figure 7 - 230 kV dead tank circuit breaker-disconnect switch configuration
4. Interconnected system response patterns
One important observation from analysing measurements from the above shake table experiments is that interconnected system response occurs as a combination of a few patterns or response modes, and that by characterizing these modes, key response quantities such as equipment base moment can be predicted. These patterns are identified using an eigensystem realization algorithm [6]. They are summarized in Table 1 for one test configuration – the bushing-surge arrested interconnection for one set of mass/stiffness settings and the Cowslip conductor (middle conductor in Figure 2).
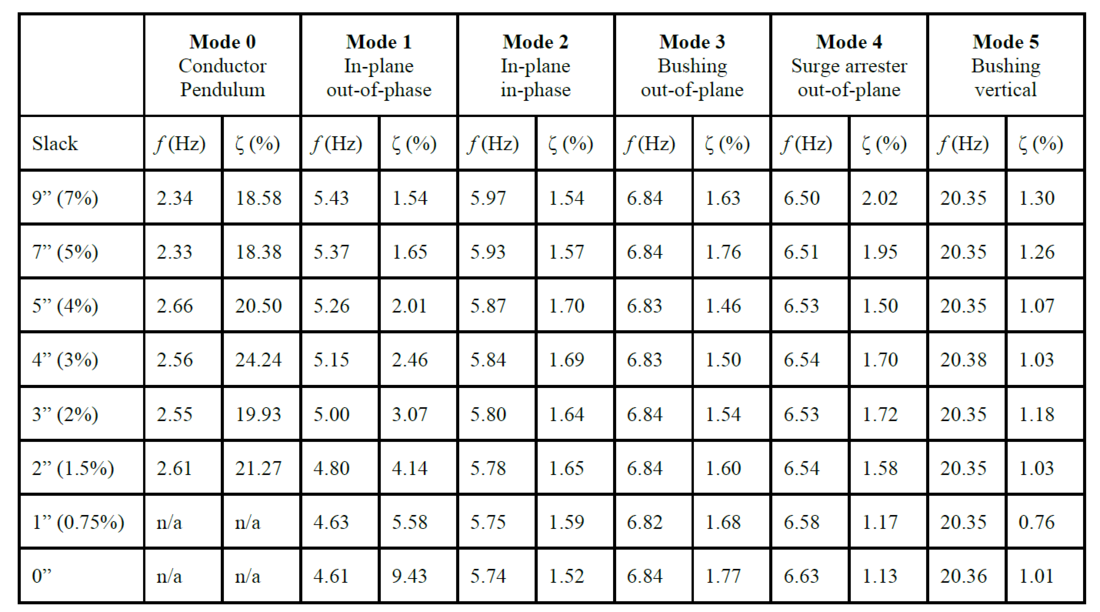
Table 1 - Response patterns for interconnected transformer bushing-surge arrester system (f=frequency; ζ=damping ratio, 1 in = 24.5 mm))
Table 1 shows 6 modes, and how their frequency and damping ratio change with conductor slack.
Mode 0 – conductor pendulum mode: In this mode, the conductor swings out of plane like a pendulum (similar to the illustration in Figure 4) with both equipment remaining essentially stationary. The frequency of this mode increases with decreasing slack, since the pendulum length decreases. This mode is highly damped with a damping ratio in the range of 20%.
Mode 1 – In-plane out-of-phase mode: The mode involves the two equipment displacing in plane and out-of-phase relative to each other. This is the mode that causes the conductor to because taut and slack, the type of response of concern in the IEEE 1527 recommendations. A couple of observations about this mode are counterintuitive:
- The frequency of Mode 1 is less than that of Mode 2 (in which the equipment displace in phase): This is counter to general experience from multi-DOF system dynamics, where higher frequency modes have greater degrees of out-of-phase patterns. The reason Mode 1 has a lower frequency than Mode 2 is because of greater engagement of the vertical mass of the conductor. The smaller the slack, the greater the rate of change of sag for the same rate of change of slack. Hence, the conductor mass is engaged to a larger extent, thus reducing the frequency. This is also the reason that the frequency of Mode 1 decreases with decreasing slack in Table 1.
- The damping ratio of Mode 1 increases substantially with decreasing slack: The exact physical reasoning for this is still unclear, but this is observed with all conductor types. With the out-of-phase mode already not excited by ground motion as much as the in-phase mode, what this means is that the participation of this mode in the interconnected system response diminishes significantly with decreasing slack. Thus the conductor developing large terminal forces due to opposing relative displacement, as posited in the IEEE recommendations, does not occur.
When Mode 1 and Mode 0 have an integer frequency ratio, a nonlinear resonance effect occurs, as discussed in Sections 2 and 6. It can be seen immediately the relationship between Mode 1 and Mode 0 is the same as between in-plane excitation and out-of-plane response described in Section 2.
Mode 2 – In-plane in-phase mode: Here, the two equipment move in phase. The frequency of this mode decreases slightly with decreasing slack. This is simply because mode of the conductor is near the top, and therefore contributes more to the overall mass moment of inertia. The damping ratio is relatively unaffected by slack, although increased by bending effects in the conductor relative to the standalone equipment. The critical quantity of interest when assessing seismic safety is the equipment base moment. The in-plane equipment base moment is determined almost entirely by Mode 2. Thus if equipment dynamics is know from qualification tests, then the frequency of Mode 2 can be determined, and with an estimate of damping ratio, base moment can be estimated. This offers a path to rationally account for interaction.
Modes 3 and 4 – Out-of-plane modes: These are the out-of-plane modes of the equipment, and as expected are unaffected by conductor slack. The conductor, however, still contributes to greater damping in these modes relative to the standalone damping.
Mode 5 – Bushing vertical mode: This mode is also unaffected by conductor slack. While it does not contribute to equipment base moment, it does contribute to terminal forces. In addition, when the frequency of this mode is an integer multiple of Mode 2 or Mode 3, another nonlinear resonance effect can occur, as outlined in Section 5.
The circuit breaker-disconnect switch configuration also exhibits response patterns, and base moment can be predicted with knowledge of a select few of these modes. The modes of this configuration are not presented here.

5. Nonlinear dynamic effect in bushing
Tests of the bushing in Figure 6 standalone without interconnection, and for one case of the cover plate without any stiffeners, serendipitously revealed a nonlinear dynamic effect. The following are observed.
- When a broad-band excitation is applied in the longitudinal direction, a much larger vertical response is obtained than predicted by a linear model, as shown in Figure 8.
- When a broad-band excitation is applied in the vertical direction, much larger longitudinal and transverse responses are obtained than predicted by a linear model, as shown in Figure 9.
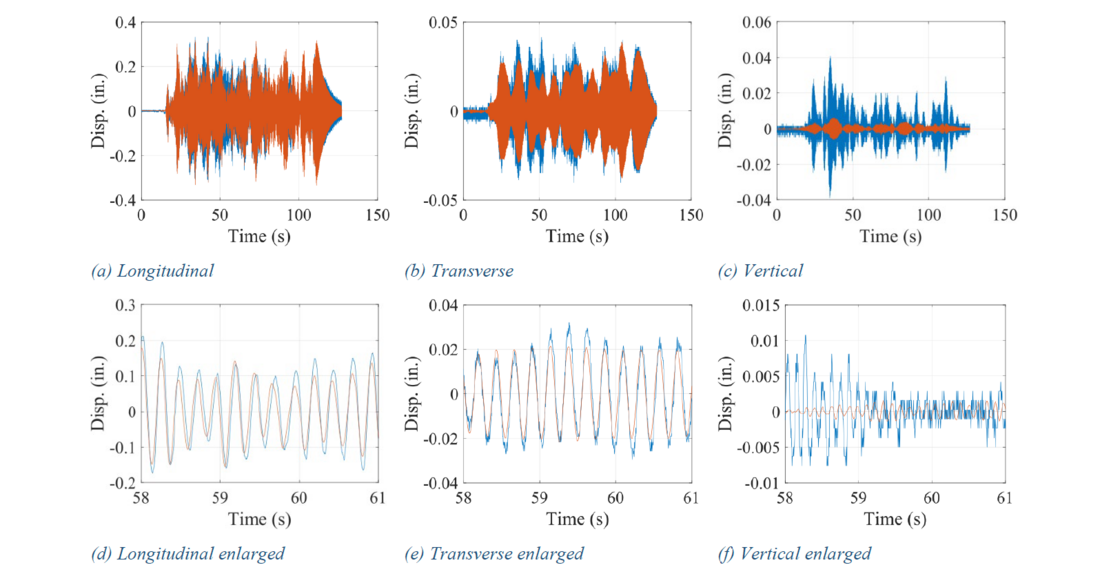
Figure 8 - Displacement response of standalone bushing with unstiffened cover plate under 0.1g white noise in longitudinal direction; blue curves represent measurements, and red curves predictions from a linear model (1 in = 25.4 mm)
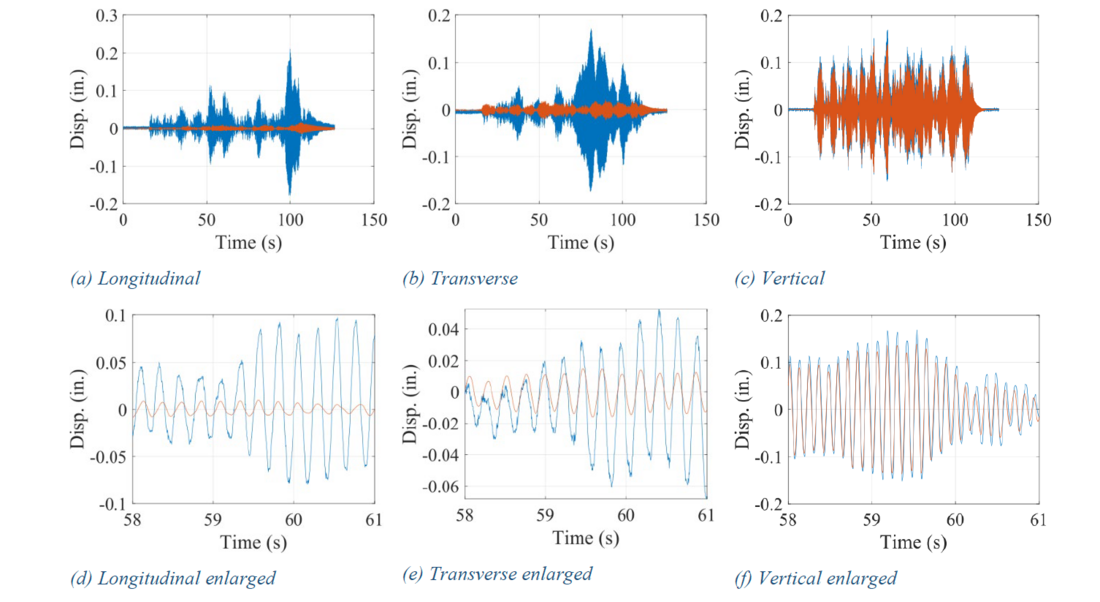
Figure 9 - Displacement response of standalone bushing with unstiffened cover plate under 0.1g white noise in vertical direction; blue curves represent measurements, and red curves predictions from a linear model (1 in = 25.4 mm)
Careful examination of these observations reveals an interesting nonlinear dynamic effect. The vertical frequency of the bushing is 8.6 Hz, while frequencies of rocking in the longitudinal and transverse directions are both 4.2 Hz (Figure 10). Since the vertical frequency is approximately twice the rocking frequency, a 2:1 parametric resonance [7] occurs.
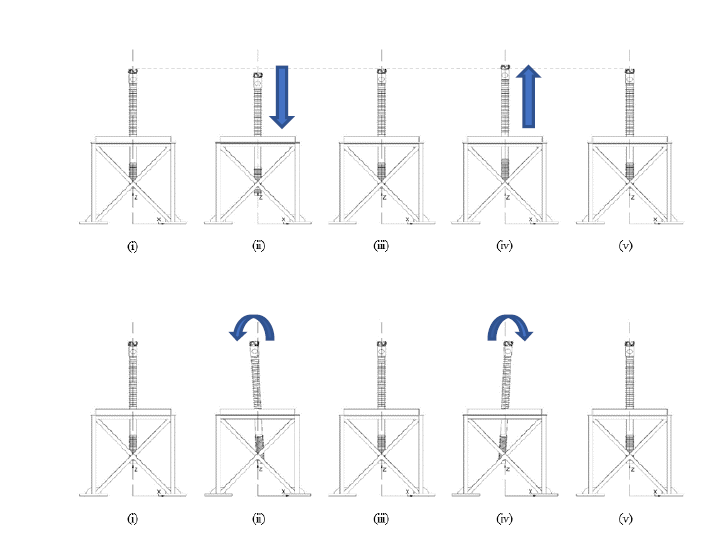
Figure 10 - Vertical and rocking modes of bushing – frequencies 8.6Hz and 4.2Hz with unstiffened cover plate
When the bushing is excited vertically with white noise, it responds predominantly with the vertical frequency, rendering the two rocking modes unstable, and resulting in large rocking motion as seen in Figure 9. Recent further research [8] showed that when the bushing is mounted in an inclination, the amplification of base moment due to parametric resonance could be even more significant. It may be beneficial for transformer manufacturers to be aware of this effect to minimize any potential base moment amplification.
6. System-level parametric resonance effect
The theme of parametric resonance effects continues at the system level. For very large and very small conductor slacks, the interconnected system response is essentially linear, and the base moment can be estimated from Mode 2 (in-plane in-phase) as discussed in Section 4. Supporting data and reasoning can be found in reference [5]. However, for intermediate slacks, it is possible that the frequency of Mode 1 (in-plane out-of-phase) is close to an integer multiple of the frequency of Mode 0 (conductor pendulum). This can be seen, for example, in the 5th row of Table 1. This results in a parametric resonance. Figure 11 shows an example of response when this occurs. In this figure, red lines indicate response at 1g-level excitation, while blue lines denote 5×response at 0.2g-level excitation; the difference between these two lines is a measure of deviation from linearity. In Figure 11(a) there is some nonlinear effect in the terminal force, whereas this does not have much effect on the base moment. The consequence of this type of parametric resonance is therefore mild.

Figure 11 - Bushing terminal force and base moment when the Mode1:Mode0 frequency ratio is 2:1. Red curves indicate response at 1g excitation; blue curves indicate 5×response at 0.2g excitation

Figure 12 - Bushing terminal force and base moment when there is bushing parametric resonance and the Mode1:Mode0 frequency ratio is 2:1. Red curves indicate response at 1g excitation; blue curves indicate 5×response at 0.2g excitation
A more dramatic effect is seen when not only is the Mode 1: Mode 0 frequency ratio 2:1, but also the bushing configuration is such that it has a vertical-rocking parametric resonance as discussed in Section 5. The resulting response is shown in Figure 12. A large spike occurs in the bushing terminal force, and some corresponding high-frequency ringing in the base moment. From the analysis of the last three sections, it can be seen that the interconnected system can be viewed in terms of response patterns and parametric resonance effects that stem from geometric nonlinear behavior at certain frequency ratios. This is summarized in the form of a flowchart in Figure 13.
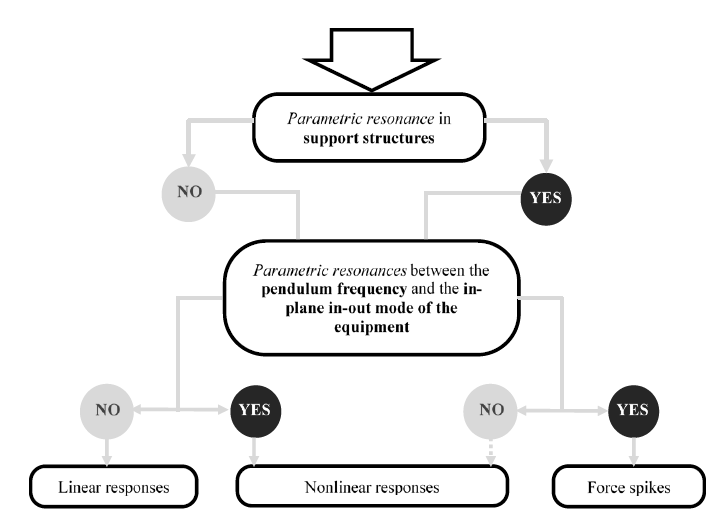
Figure 13 - Classification of nonlinear effects in interconnected equipment
7. Computational tool
As part of this research, a new software program has been developed for computational simulation of seismic response of substation equipment interconnected flexible conductors [9].
The program is distinguished by some novel algorithmic features.
1. B-Spline functions
For representation of the flexible conductor geometry, B-Spline functions (see for example [10]) are used. This is in contrast to most software that use finite elements. This choice is made because B-Spline functions allow for an arbitrary degree of smoothness of the geometry. Since the deformation of the conductor is smooth, and the conductor curvature is continuous, B-Spline functions result in far fewer degrees of freedom, and hence computational efficiency.
2. Kirchoff rod theory and constraint-free implementation
Conductors being structurally slender, Kirchhoff rod theory [11] is used for modelling; this avoids the need for large moduli to constrain shear deformation. Similarly, constraints using stiff members is avoided; for example, for double conductors, the spacers are modelled using rigid offsets rather than stiff members. This makes the mathematical formulation more involved, but results in better numerical conditioning and hence more efficient convergence.

3. Differential equation solvers with error control and adaptive time-stepping
Other elements of the mathematical formulation such as directly computing centrifugal and Coriolis forces resulting from conductor nonlinear geometry, and their derivatives, enables the use of powerful off-the-shelf differential equation solvers with error control and adaptive time-stepping. Greater computational effort is expended during time steps where the response is complex, and uniformly small time step is not needed simply to ensure convergence.
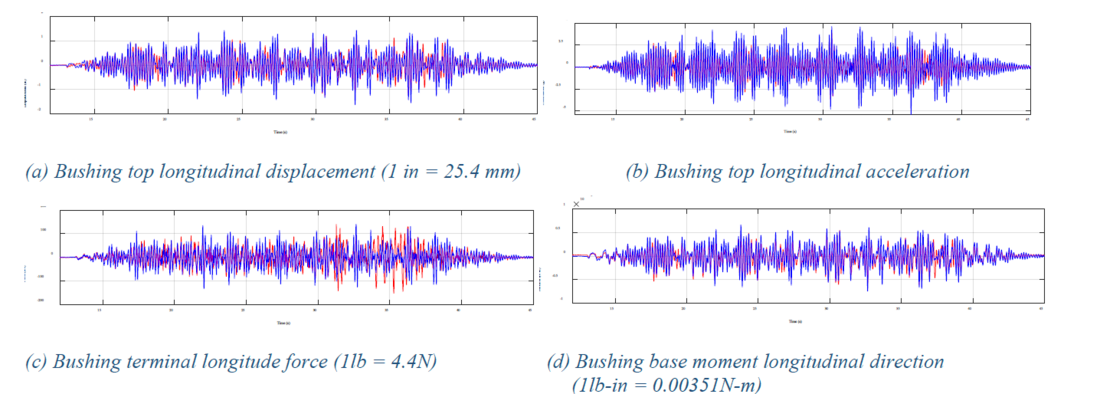
Figure 14 - Comparison of some results from computational simulation with experimental measurements for on test configuration of Figure 6 (Cowslip conductor at 2-in slack with stiffened cover plate under 1g 3D CERL ground motion)
The program has been validated using measurements from experiments described in Section 3. Figure 14 shows a comparison between results from computational simulation and measurements for one case. The program has also been verified for a large-scale model of a 230 kV equipment bay using the well-know finite element program, FEAP [12]. This equipment bay, shown in Figure 15, is one of several such models in reference [2] that was used to inform some of the recommendations in the current edition of IEEE 1527. Figure 16 shows this comparison between the newly developed program and FEAP. The program is currently developed within the MATLAB [13] environment. Efforts is underway to develop a standalone executable without MATLAB dependency for ease of use by utilities. A web-based interface is also under development.
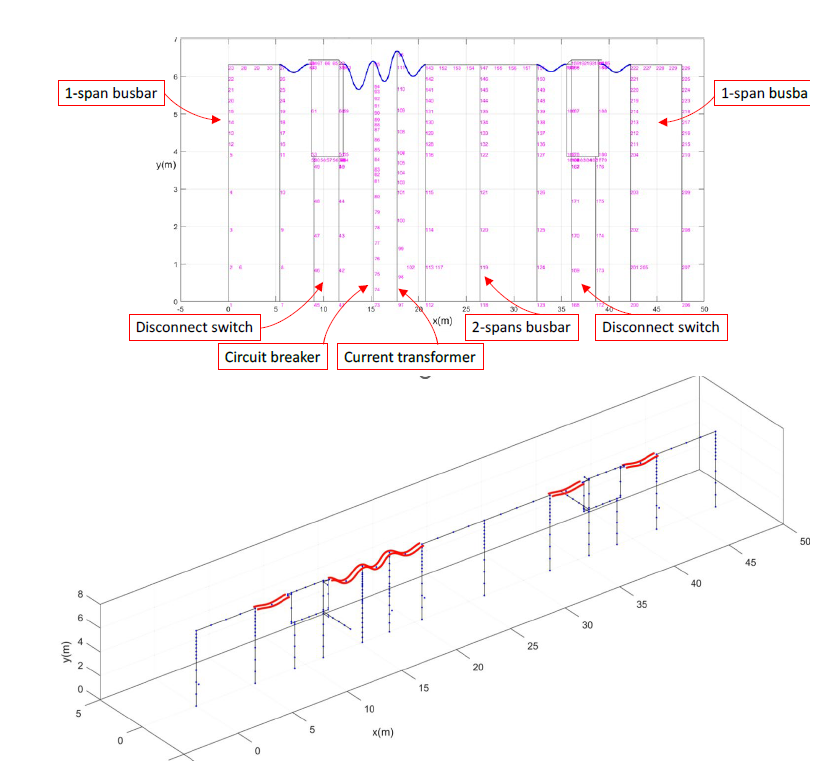
Figure 15 - 230 kV equipment bay from reference [2] that was used to inform IEEE 1527
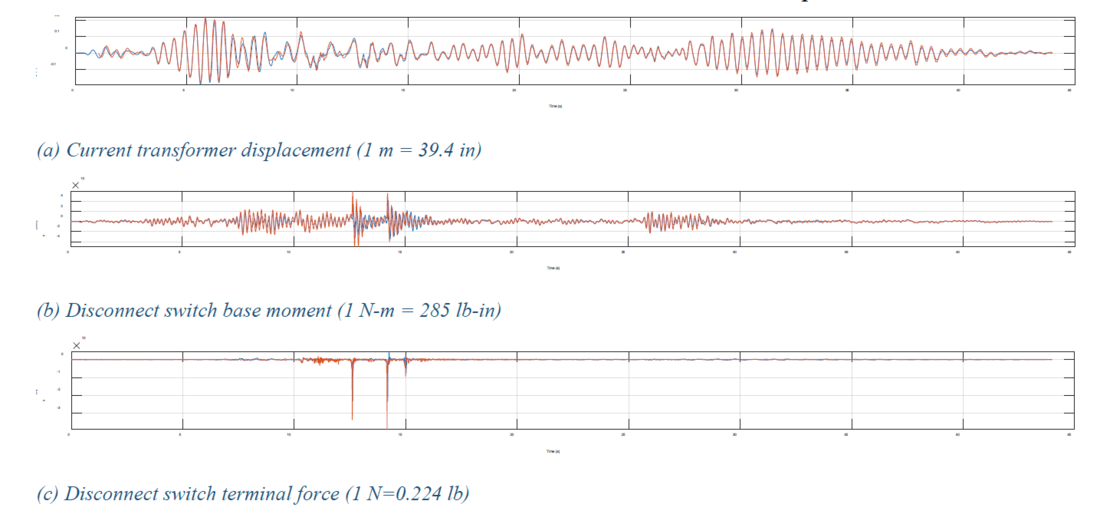
Figure 16 - Comparison between the newly developed computer program and FEAP for a 230 kV equipment bay (Figure 15, [2]). Blue curves are from the newly developed program and red curves are from FEAP
8. Model-in-the-loop test system
As seen from the discussion in Sections 4—6, response of the interconnected system depends on dynamic coupling between the equipment and the flexible conductor. However, testing complete interconnected systems is most often not possible. Even test configurations such as in Figure 6 and Figure 7 have limitations. For example, in the circuit breaker-disconnect switch configuration, the circuit breaker insulator dynamics were not represented. One dynamic characteristic that is particularly difficult to reproduce or vary is damping. For these reasons, it is attractive to explore an alternate approach to testing the interaction dynamics. Equipment dynamic characteristics can be established from qualification test data. Therefore, if the equipment dynamics can be simulated virtually using a computer model, and the conductor and its interaction with the equipment can be represented physically, that would enable the testing to focus on the interaction dynamics. This is the concept behind the model-in-the-loop test system shown in Figure 17, developed uniquely as part of this research program. Two equipment simulators, each driven by two hydraulic actuators, represent the equipment. Conductor terminal forces are measured and fed to computer models of the equipment; these models then drive the equipment simulators in real-time to imitate the equipment dynamics [14]. It has been validated that the equipment simulators accurately imitate several equipment dynamics scenarios, and hence can be used with confidence in practice. One limitation we are currently working on overcoming is being able to imitate equipment that are very lightly damped (<1% damping ratio).
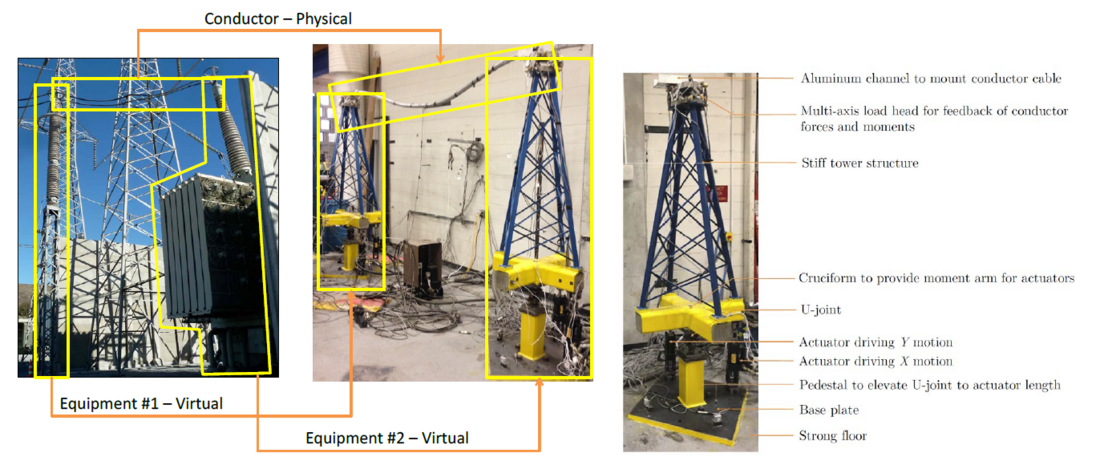
Figure 17 - Model-in-the-loop system for testing conductors with virtual equipment dynamics - a) Concept of sub-structuring - b) Details of an equipment simulator
9. Concluding remarks and lessons learned
Motivated by knowledge gaps in seismic response of substation equipment interconnected by flexible conductors, a comprehensive research program has been undertaken. The outcomes from this program are two-fold:
- A collection of validated tools that can be deployed by utilities to assess seismic performance of systems on a case-by-case basis. A new computational tool developed, described in Section 7, is well suited for this. Experimentally, the model-in-the-loop system described in Section 8, can be also be used to test specific conductor configurations.
- The multifaceted approach has uncovered key fundamental principles about the response of equipment interconnected by flexible conductors. These principles are aggregated in two groups:
- Response modes of interconnected systems - Interconnected systems response predominantly in modes or patterns, such as the bushing-surge arrester configurations, these modes include the two simulated substation equipment moving in phase, out of phase, the conductor pendulum swinging. These modes are consistent and exhibit gradual trends with varying parameters such as equipment frequency and conductor slack. Modes that contribute substantially to equipment base moment are readily identified.
- Nonlinear dynamic effects – parametric resonances - Parametric resonances occur when system modes have frequencies in integer ratios, for example, when the vertical and rocking modes of a bushing, or system out-of-phase mode and the conductor swinging mode have frequencies with a ratio 2:1. When parametric resonances are present, significant amplification of the conductor terminal forces occur. These fundamental principles provide a pathway to account for the effected of flexible conductor interaction in design and qualification of substation equipment.
With equipment qualification test data, and properties of the conductors, the frequencies and damping ratios of primary response modes of the interconnected system are determined. With this information, equipment base moments can be estimated from seismic design spectra. This approach mirrors well-developed standards for seismic design of structures. Furthermore, substation equipment interconnected flexible conductor systems can be designed to avoid critical frequency ratios, avoiding amplifying equipment base moment effects from parametric resonances. This research can be used by IEEE’s 693 and 1527 standards for consideration of future modification.
References
- Fu, Y., et al., Six-axis load head with application to electrical conductor nonlinear dynamics. Experimental Techniques, 2021. 45(1): p. 67-81.
- Dastous, J.-B., Guidelines for seismic design of flexible buswork between substation equipment. Earthquake Engineering and Structural Dynamics, 2007. 36(2): p. 191-208.
- Fu, Y. and M.V. Sivaselvan, Nonlinear dynamics of short-span electrical conductor cables under uniaxial periodic excitation. Journal of Sound and Vibration, 2023. 543.
- University at Buffalo. Earthquake simulators. 2004 [cited 2023 December 22]; Available online
- Fu, Y., Seismic interaction of high-voltage substation equipment interconnected by flexible-bus conductors. 2020, Ph.D. Dissertation, University at Buffalo: Buffalo, NY.
- Juang, J.N. and R.S. Pappa, An eigensystem realization algorithm for modal parameter identification and model reduction. Journal of Guidance, Control, and Dynamics, 1985. 8(5): p. 620-7.
- Tondl, A., Autoparametric resonance in mechanical systems. 2000, Cambridge, UK ; New York: Cambridge University Press. x, 196 p.
- Sivaselvan, M.V., Parametric resonance effects in the seismic eesponse of substation equipment: Summary of experimental findings. 2023, Electric Power Research Institute (EPRI): Palo Alto, CA.
- Osloub, E., A B-Spline Kirchhoff rod model and its application to flexible conductors for seismic response simulation of interconnected high-voltage substation equipment. 2023, Ph.D. Dissertation, University at Buffalo: Buffalo, NY.
- Piegl, L.A. and W. Tiller, The NURBS book. 2nd ed. Monographs in visual communications. 1997, Berlin ; New York: Springer. xiv, 646 p.
- Osloub, E., V.B. Kote, and M.V. Sivaselvan, Formulas for rotation and angular velocity arising from shake table kinematics and kirchhoff rod model implementation. Journal of Engineering Mechanics, 2021. 147(1).
- Taylor, R.L., FEAP - Finite Element Analysis Program. 2014, University of California, Berkeley.
- The Mathworks Inc., MATLAB version: 9.12.0 (R2022a). 2022, Natick, Massachusetts: The MathWorks Inc.
- Kote, V.B., Model-in-the-Loop testing of flexible-bus conductors interconnecting substation equipment. 2019, Ph.D. Dissertation, University at Buffalo: Buffalo, NY.

