C5 - Transforming the power system for future generations – the role of dynamic capacity markets and de-rating factors
Author
Aodhagan DOWNEY - EirGrid, Ireland

Summary
This paper focuses on the role that dynamic capacity markets can play in supporting the transformation of the power system to low carbon technologies while maintaining reliability. In particular, the paper discusses the importance of how de-rating factors – that apply to different technologies in line with their contribution to reliability – evolve over time in response to the changing portfolio. While capacity markets and de-rating factors are not new concepts, the capacity market in Ireland and Northern Ireland contains several innovative features that promote investment in a balanced portfolio required to support the levels of penetration of variable renewables required to fully decarbonise the power system.
In the capacity market, generators and demand side units are paid capacity payments in exchange for delivering energy to the system when they are needed most. Capacity payments are allocated four years in advance on a competitive basis in a capacity auction. For each capacity auction, each qualified unit is de-rated based on its contribution to reliability. The de-rating of a unit is based on: the unit’s technol-ogy class (gas turbine, steam turbine, wind, solar, hydro, demand side, storage), the unit’s size (bigger the unit, smaller the contribution to reliability per MW) and the duration the unit can operate continu-ously at full output (where shorter durations contribute less to reliability).
Using de-rating factors published by EirGrid and SONI, the System Operators for Ireland and Northern Ireland respectively, for a number of recent Capacity Auctions, this paper will show how de-rating factors have evolved over time in response to changes in the portfolio. We will discuss a number of emergent effects including a net demand effect, a saturation effect and capacity effects including an availability effect, a size effect and an energy limit effect.
All of these effects reflect dynamic changes to the structure of the power system and the way each effect evolves and interplays with the other effects gives rise to the de-rating factors in a particular year. Re-flecting the fundamentals of a reliable power system in the market signals is critical to promoting the necessary investment in the right balance of different technologies to support high levels of variable renewables.
Keywords
Capacity Market, De-Rating Factors, Reliability Standards, Renewables, LOLP, ELCC1. Background
Ireland and Northern Ireland have among the highest penetrations of variable renewables on a single synchronous system in the world, with up to 75% of instantaneous demand capable of being met by non-synchronous sources such as wind and solar. The level of installed renewables is expected to grow sig-nificantly over the coming years to meet renewable targets of 80% of demand from renewable resources by 2030 (up to 95% of instantaneous demand). In addition to variable renewables, the portfolio also includes increasing amounts of storage, interconnection, demand side response, as well as a new fleet of flexible gas turbines to replace older more carbon intensive units [1].
In the capacity market, generators are paid capacity payments in exchange for delivering energy to the system when they are needed most. Since the beginning of the capacity market in Ireland and Northern Ireland in 2018, over €9 billion in capacity payments have been allocated to existing and new capacity between 2018 and 2036 [2]. Capacity payments are allocated four years in advance to the most compet-itive capacity in a capacity auction. For each capacity auction, each unit is de-rated by a factor between 0 and 1 based on its contribution to reliability. A unit’s technology class (gas turbine, steam turbine, wind, solar, hydro, demand side, storage), a unit’s size (bigger the unit, smaller the contribution to reli-ability per MW) and the duration that a unit can operate continuously at full output (where shorter durations contribute less to reliability), all contribute to a unit’s de-rating factor [3].
The Capacity Requirement and De-Rating Factor Methodology (CRDRFM) [7][8] is used to calculate de-rating factors ex ante before qualification and is broadly based on calculating the marginal Effective Load Carrying Capability (ELCC) for a set of technology classes. Originally developed in the middle of the 20th century [4],[5], it has been employed more recently in capacity markets including in CAISO in California and PJM, NYISO and ISO-NE on the east coast of North America. ELCC is used to repre-sent the contribution of a resource to overall system reliability. In most instances, ELCC has been used to represent the contribution of variable resources such as wind and solar and energy limited resources such as various forms of storage [6].
Ireland and Northern Ireland have been applying ELCC-based de-rating factors in the capacity market since 2018 and are among the only markets in the world that apply marginal ELCC-based de-rating factors universally to all resources including more conventional thermal units and interconnection [6]. Applying this approach universally, as is done in Ireland and Northern Ireland, ensures that all technol-ogy classes can compete on a level playing field. Figure 1a provides a conceptual overview of the CRDRFM.

Figure 1 - (a) Conceptual view of the CRDRFM and (b) a typical LOLP curve for Ireland and Northern Ireland
At the core of the CRDRFM is adequacy analysis based on the calculation of Loss of Load Probability (LOLP) for each hour in the year. Figure 1b shows a typical LOLP curve for Ireland and Northern Ireland. LOLP values in each half-hour are driven by an almost exponential inverse relationship with system margin, which is the expected availability of generation less the demand. Where the margin is more broadly distributed about the mean, LOLP values will be much more broadly distributed about the mean due to the relationship between margin and LOLP.
The initial steps of the CRDRFM include gathering of historical demand and generator availability pro-files and statistics. It also includes making assumptions on the expectations of demand and installed wind, solar and energy limited capacity in the delivery year. These are based on latest information from the Generation Capacity Statement, which is published annually looking forward at the expected changes in supply and demand in Ireland and Northern Ireland over the next ten years, e.g. [9].
Figure 2 shows how this information is combined to form demand scenarios. High and low forecast peak values are taken from the Generation Capacity Statement for the capacity year in question. Based on these values, a number of intermediary demand forecasts are calculated (normally ten altogether including the high and low values). A set of historical demand profiles (normally eight) are used to represent varying demand shape over recent years. Each demand scenario is created by growing each demand profile to the peak and energy values for each demand forecast e.g. where there are ten demand forecasts and eight demand profiles, this would result in 80 demand scenarios in total, each with 17,340 half hour values. EirGrid and SONI then take the forecast installed capacity of wind and solar generation in Ireland and Northern Ireland for the period and using profiles from the corresponding years, subtract the expected wind and solar generation from the demand scenarios. Only corresponding profiles are used so this does not increase the number of demand scenarios. Once the demand scenarios have been adjusted for wind and solar output, these represent net demand scenarios. The term demand scenarios used in this paper refers to net demand scenarios, unless otherwise stated.
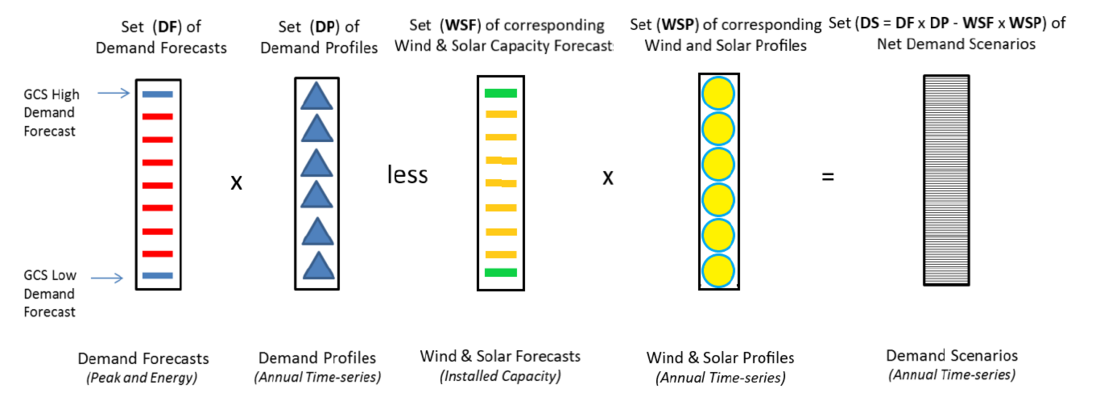
Figure 2 - Calculation of Net Demand Scenarios
Figure 3 represents the next stage of the process, where capacity adequate portfolios are generated ran-domly and marginal de-rating factors are calculated for each portfolio g, for each demand scenario ds, for a notional unit GX for each technology class (gas turbine, steam turbine, hydro, interconnector, de-mand side unit, pumped hydro storage unit, other energy storage, wind and solar), each capacity level (in increments of 10 MW from 10 MW to 700 MW) and each full load hour step (in increments of 0.5 hours from 0 to 6 hours).
The randomly generated portfolios represent, in effect, notional outcomes of the capacity auction. By calculating marginal de-rating factors using these portfolios, the marginal contribution to reliability of each capacity unit is represented across a variety of possible auction outcomes. This is important as the makeup of the underlying portfolio impacts the marginal de-rating factors of each technology class. Calculating de-rating factors across a number of portfolios ensures that de-rating factors are not unduly influenced by the particulars of any one assumed portfolio.
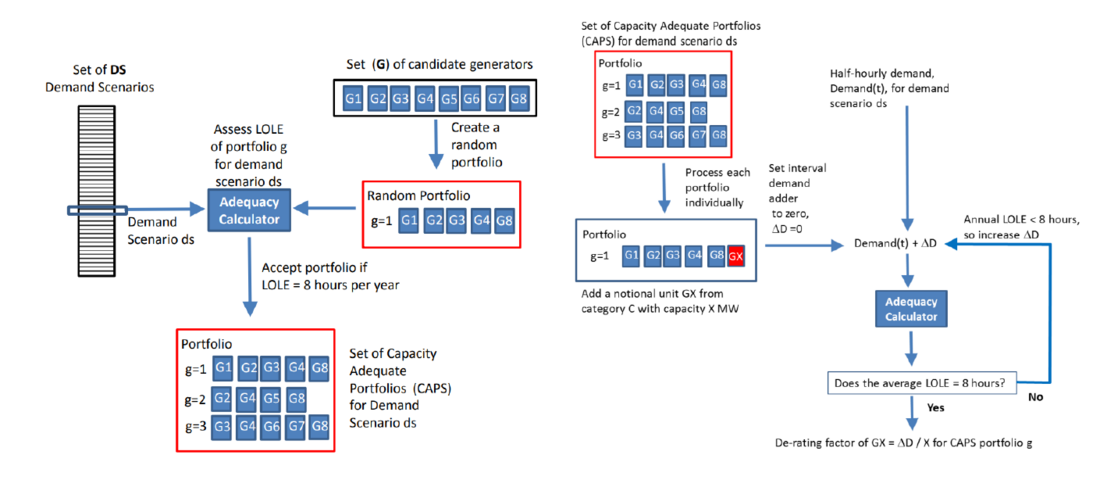
Figure 3 - De-Rating Factor Calculation Process
Once de-rating factors have been calculated for each demand scenario, they are applied to the units in that portfolio and the sum of the de-rated capacity in the portfolio represents the capacity requirement for that demand scenario. This capacity requirement and the associated de-rating factors by technology class, size level and as appropriate full load hours (for storage and Demand side units) represent the outputs of the CRDRFM for that demand scenario.
As the capacity auction is a pay-as-clear auction, the capacity auction price is calculated on a marginal pricing basis. Putting these together, the capacity auction price in a capacity auction represents how much would it cost the end user, in terms of the incremental investment cost required to deliver an incremental amount of reliable capacity. Adopting marginal de-rating factors in the context of marginal pricing ensures that the auction delivers efficient entry and exit signals.
The last stage of the process set out in Figure 1 is the least worst regrets analysis, which is used to select the appropriate demand level on which to base the capacity requirement. The demand levels correspond to the demand forecasts. Details of this process lie beyond the scope of this paper and can be found in the reference [8]. In short, the regret cost of each demand scenario is calculated based on the risk of under- or over-procurement priced at the Value of Lost Load (VoLL) and Net CONE respectively. The worst regret cost is calculated for each demand level and the demand level with the least worst regret cost is selected. Capacity requirements and de-rating factors are averaged across all demand scenarios in the demand level, and these represent the final values to be used in the capacity auction.
2. Methodology
This paper analyses de-rating factors published by EirGrid and SONI for a number of capacity auctions. Normally, there are two capacity auctions per year, a T-4 capacity auction, which runs four years prior to the delivery year and a T-1 Capacity Auction, which runs in the year prior to the upcoming delivery year. This analysis focuses on the de-rating factors calculated for the 2023/2024 T-1 Capacity Auction [10] and the de-rating factors for the 2027/2028 T-4 Capacity Auction [11]. Both auctions were held in 2023 and are the most recent auctions to have taken place at the time of writing. In addition, further analysis is carried out using a LOLP Calculator similar to the one used at the core of the CRDRFM using data for the 2024/2025 capacity year.
This paper discusses the following questions in relation to a number of emergent effects in response to the evolving portfolio in Ireland and Northern Ireland including:
- Net Demand Effect – how does the representation of demand as net demand rather than gross demand impact on de-rating factors and incentives to invest in different technology classes?
- Capacity Effects -
- Availability Effect – As the forced outage probability of a technology class increases, what is the impact on de-rating factors? How does change with respect to other drivers of relia-bility namely, size, energy limits, etc, impact on this effect?
- Size Effect – what impact does the magnitude of the installed capacity of a unit have on its contribution to reliability?
- Energy Limit Effect – is the technology class subject to an energy limit such that it can only run for part of the day? How does this impact de-rating factors.
- Saturation Effect – as the penetration of a particular technology class increases (i.e. its per-centage of the overall capacity), how do the de-rating factors change?
Results and discussions of analysis in respect of these questions are covered in the next section.
3. results and discussion
3.1. Net Demand Effect
In 2022, the System Operators in Ireland and Northern Ireland introduced several important develop-ments in how a generator/demand side unit’s contribution to reliability is measured. Previously, margin was calculated as expected generation (where wind and solar were represented by a constant capacity credit) less forecast demand. In the updated approach, margin is calculated as expected generation less forecasted net demand (demand less wind based on actual profiles) (see Figure 2).
Figure 4 shows how accounting for wind and solar profiles differently can impact LOLP calculations. The particular year shown is based on the 2024/2025 capacity year with demand levels referring to demand forecast levels for that year.
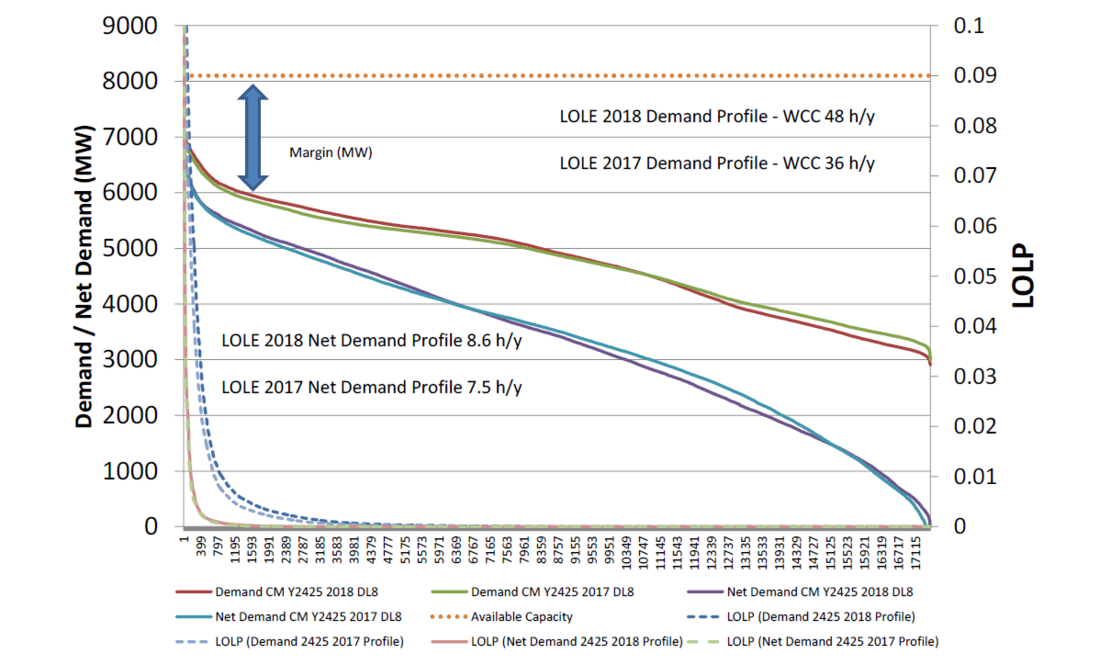
Figure 4 - Difference between LOLP calculation for Demand and Net Demand
Two demand scenarios are shown for demand level 8 using the 2017 demand profile and demand level 8 using the 2018 profile. These two demand scenarios are represented in two different ways: (a) gross demand (i.e. demand before netting off wind and solar) adjusted for wind and solar generation using wind and solar capacity credits and (b) net demand (i.e. where wind and solar profiles have been sub-tracted from the gross demand profiles). Demand duration curves are shown for both demand scenarios for both gross and net representations. The availability of capacity is represented as a flat dotted profile across the year for simplicity. Finally, the LOLP profiles for the margins, calculated by subtracting each of the four demand representations from the one availability profile, are shown. Loss of Load Expecta-tion (LOLE) values for the year, which are calculated as the sum of all the LOLPs across the year for each demand representation are also shown.
As discussed, there is an almost exponential inverse relationship between margin and LOLP. As such, reasonably small differences in margin can result in significant differences in LOLP. When we look at Figure 4, we can see that the LOLP calculations from using net demand and gross demand representa-tions are significantly different. It can be seen that both the demand scenarios have very similar gross demand duration curves indicating that demand in Ireland and Northern Ireland followed a similar pat-tern in the two profile years 2017 and 2018. It is argued here that the difference in LOLP therefore arises primarily from how wind and solar are represented.
If we consider gross demand representations, including wind and solar as capacity credits represents this capacity as a flat profile across the year based on their ELCC. Representing the capacity as a capac-ity credit was considered to be the most accurate way of representing wind and solar capacity’s contri-bution to reliability based on the premise that it is not possible to predict the half-hourly wind and solar output several years ahead (especially for wind). Represented this way, the demand duration curves are flatter reflecting the profile of the gross demand duration curve.
Turning our attention to the net demand representations, we see, surprisingly, that both net demand duration curves are also very similar. While the gross demand profiles between 2017 and 2018 are very similar, the wind (in particular) and solar profiles are completely different between any two years. Con-sidering a greater number of annual profiles for a different capacity year, Figure 5a shows daily statistics (for half hour number 35) across eight demand scenarios for 2027/2028 for the same demand forecast (level 5) with different demand profiles (from 2011 to 2018). As can be seen, the standard deviation across the profiles is reasonably low indicating that demand profiles across eight different years are reasonably similar.
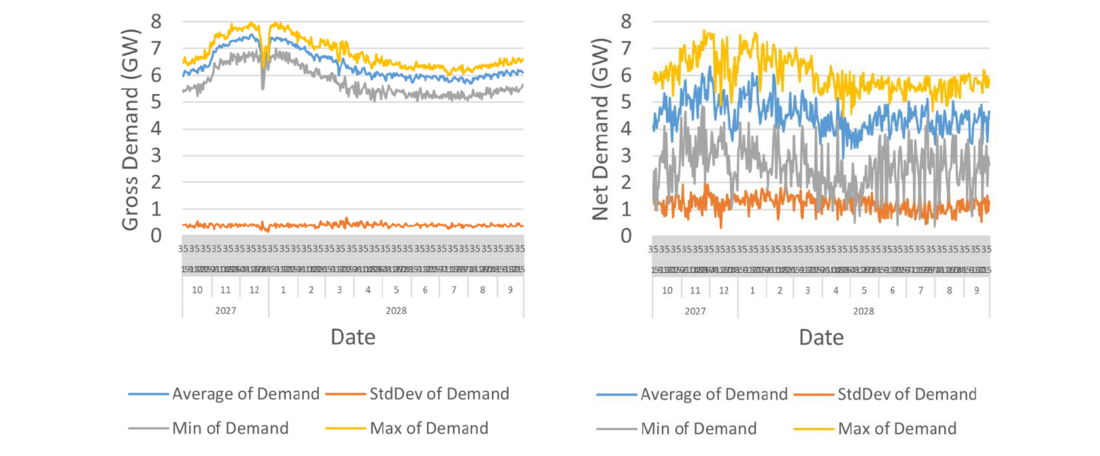
Figure 5 – Daily statistics for half hour 35 of each day from 1st Oct 2027 to 30th Sept 2028 using eight historical annual times series from 2011 to 2018 for demand level 5 scenarios for (a) Gross Demand and (b) Net Demand
Conversely, consider Figure 5b, which is the same graph as Figure 5a but for net demand profiles for the same periods. We can see that the standard deviation is significantly higher and more volatile across all periods, indicating that the output of wind and solar on any particular day varies significantly from year to year.
Finally, Figure 6 shows the distribution statistics for net demand duration curves for each of the eight profile years. These duration curves are cal-culated by subtracting the wind and solar output in each half hour from the demand in that same half hour and then sorting in order of decreasing net de-mand. Statistics are then calculated across the du-ration curves taking highest value first and then moving to next value and so on. As such, the sta-tistics for the duration curves are not a calculated across the same half hour but rather across the same order in the duration curve e.g. average of greatest value, second greatest, third greatest, and so on. As can be seen from Figure 5, as evidenced by the very low standard deviations, the eight net demand duration curves are almost identical.
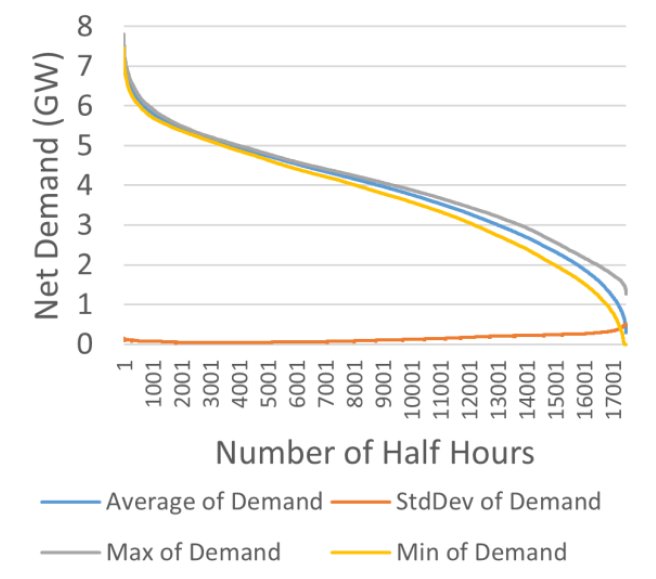
Figure 6 – Half-hourly distribution statistics for eight 27/28 net demand duration profiles from 2011 to 2018

Wind patterns (which constitutes the much higher proportion of capacity) in Ireland and Northern Ireland are driven primarily by large weather systems moving across northwest Europe. The timing, origin, and characteristics of these weather systems do not follow any reliable pattern. We do know that annual capacity factors for wind in Ireland and Northern Ireland are reasonably stable averaging at around 28% and 24% respectively [8]. So, while the timing of wind is difficult to predict, the amount of it in any one year is not. Looking at Figure 5a, we can see that demand follows similar patterns across eight separate years. From Figure 5b, we know that wind does not follow similar patterns across the eight separate years but from [8], we know that the total amount each year is reasonably stable. From Figure 6, it would appear that wind interacts with demand in a reasonably predictable manner across the whole year when we look at the net demand duration curves. What they appear to show is that while we do not know when the wind will blow exactly, we can be reasonably confident that wind will blow during roughly the same number of peak, off peak and night time periods each year such that the net demand duration curves are similar. We cannot predict the half-hourly wind (or solar) a number of years out; however, we can reasonably forecast that the same number of net demand outcomes will arise across the year. On this basis, the adequacy of a particular portfolio becomes primarily a function of demand and installed wind and solar but not of the pattern of wind in any particular year. As the penetration of solar is signif-icantly lower than wind, it is not entirely clear at this stage whether this relationship will remain valid as installed solar increases.
Going back to Figure 4, we can see that the net demand duration curves are steeper than the gross demand duration curves (adjusted by the wind and solar capacity credits). This in turn results in a re-duced number of tight margins and due to the nature of the margin-LOLP relationship as show in Figure 1b, a lower level of LOLE.
Taking a net demand approach to calculating LOLP in the presence of wind and solar has a profound impact on the nature of LOLE calculations and it perhaps more accurately represents the question most capacity markets and more generally system planners are grappling with, which is: how do we maintain levels of reliability considering the variable nature of wind and solar generation? Ensuring that there is sufficient capacity (storage, demand side response, interconnected capacity, flexible thermal, etc.) to meet the net demand curve will ensure that this problem is solved efficiently. As we will see later, the calculation of de-rating factors using net demand rather than gross demand places a greater value on, among other things, energy limited resources such as storage and demand side units.
3.2. Capacity Effects
Figure 7 shows the de-rating factor curves calculated for a number of technology classes including gas turbine, steam turbine, hydro, interconnectors and demand side units (that can operate continuously for longer than six hours).
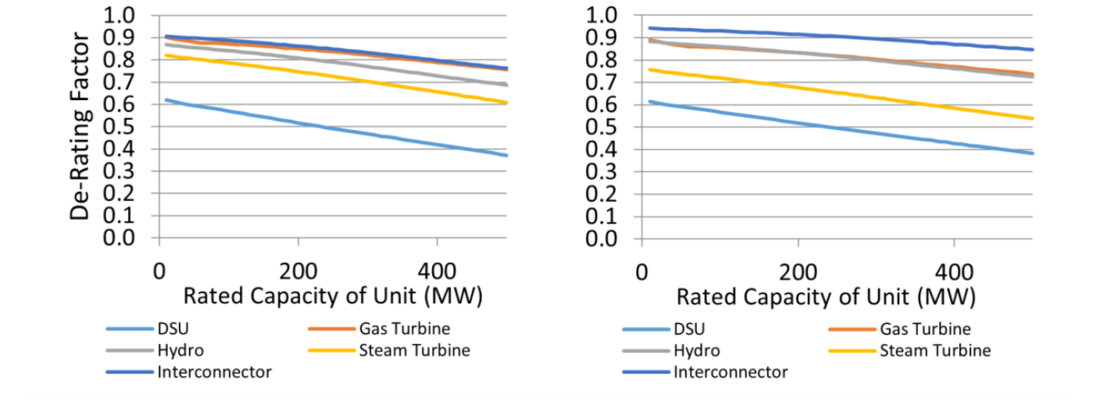
Figure 7 - De-Rating Curves for different Technology Classes for the (a) 2023/2024 T-1 Capacity Auction and (b) 2027/2028 T-4 Capacity Auction
Availability Effect – The first and arguably most significant characteristic of a unit is its availability as represented by the forced outage probability, scheduled outage rate and ambient outage profile associ-ated with the technology class that the unit is in. This information comes from historical data for existing units in each technology class. The points close to vertical axes in Figure 7 broadly reflect the forced outage probability of the units (however, the scheduled outage rates and ambient outage rates have some effect here). In general, the higher the forced outage probability, the lower the contribution to reliability of the unit and consequently, the lower the de-rating factor. This is a reasonably well-established effect.
Size Effect – The second consideration is the size of the unit in terms of its installed capacity. The larger the unit, the less the unit contributes on a per MW basis to reliability. If we consider an amount of capacity e.g. 400 MW. This could be delivered as a single 400 MW unit or as four 100 MW units. In terms of LOLP, a 400 MW will fail at a probability associated with its forced outage probability e.g. 0.05. On the other hand, losing all four of the 100 MW units simultaneously would occur with a proba-bility of 0.05 to the power of four, which is 0.00000625. Clearly, having more smaller independent units reduces reliability risks considerably. This is one of several diseconomies of scale associated with right-sizing resources to meet reliability standards at least cost [12].
For smaller systems with comparatively large generator units, as is the case in Ireland and Northern Ireland, where there is only one order of magnitude of difference between the size of larger units and the size of the demand, the impact of the failure of a large unit can have a significant impact on reliabil-ity. If capacity units were de-rated only by the forced outage probabilities, it would significantly over-state the contribution to reliability of the larger units. As shown in Figure 7, between 10 MW and 500 MW, this effect can be as high as 20% of the installed capacity or put differently, the de-rated capacity of a 500 MW gas turbine is 50% higher when size is not considered than when it is. On systems where the demand is two or three orders of magnitude greater than the largest unit, rather than one in Ireland and Northern Ireland, this effect is likely to be less pronounced.
As can be seen in Figure 7, the de-rating curves do not have the same slope with technology classes having higher forced outage rates having steeper de-rating curves suggesting a multiplicative effect be-tween forced outage probability and size.
Energy Limit Effect - A third consideration in relation to capacity is how long the unit can run for continuously at full output for. Some technology classes, namely pumped hydro storage, other storage (e.g. batteries) and demand side units, cannot operate continuously for more than a number of hours. Figure 8 shows de-rating curves for the other storage unit technology class (which would include bat-teries) as a function of size and hours at full output (which is represented by the different coloured curves).
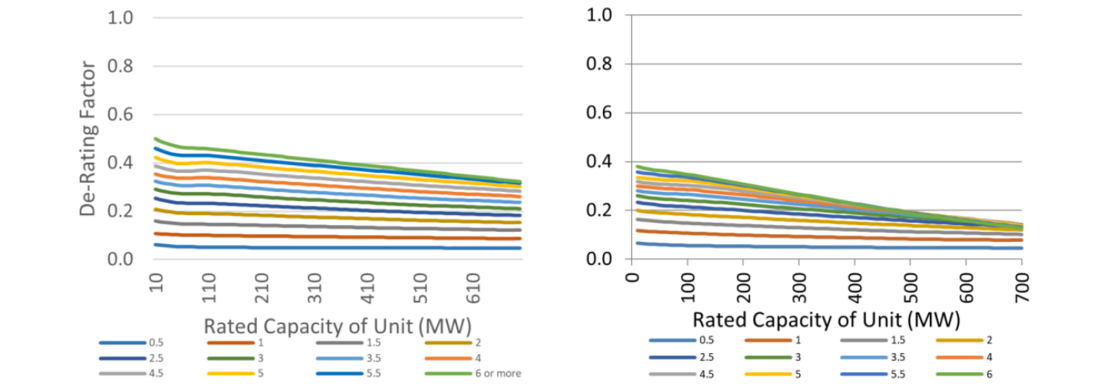
Figure 8 - De-Rating Factors for Other Storage Unit Technology Class from the, which includes Battery Energy Stor-age Systems for (a) 2023/2024 T-1 Capacity Auction and (b) 2027/2028 T-4 Capacity Auction. Different profiles repre-sent the number of hours the storage system can operate at full output
Clearly, where a unit can run for e.g. four hours, it makes a much greater contribution to reliability than a similar sized unit that can only run for e.g. one hour. For the 2023/2024 T-1 Capacity Auction, these units would be de-rated by 0.4 and 0.1 respectively representing a fourfold increase in de-rating factor. In recent years, broader incentives on battery units have tended to be weighted in favour of installed capacity (in MW) rather than storage capacity (in MWh) e.g. for operating reserve products. This has resulted in investment in short run batteries i.e. up to 30 mins. With the above de-rating factors, a 100 MWh of battery storage would have a slightly greater value as a 25 MW 4-hour battery rather than a 100 MW 1-hour battery. When considered with the smaller invertor size and smaller connection size, the 25 MW 4-hour battery may represent a more attractive investment.
Figure 9 shows current investment in battery units in Ireland and Northern Ireland. As can be seen, there is a general trend towards longer durations. As these are ten-year positions, the amount in each year adds to the previous so that in 26/27, the total is ap-prox. 374 MW (de-rated).
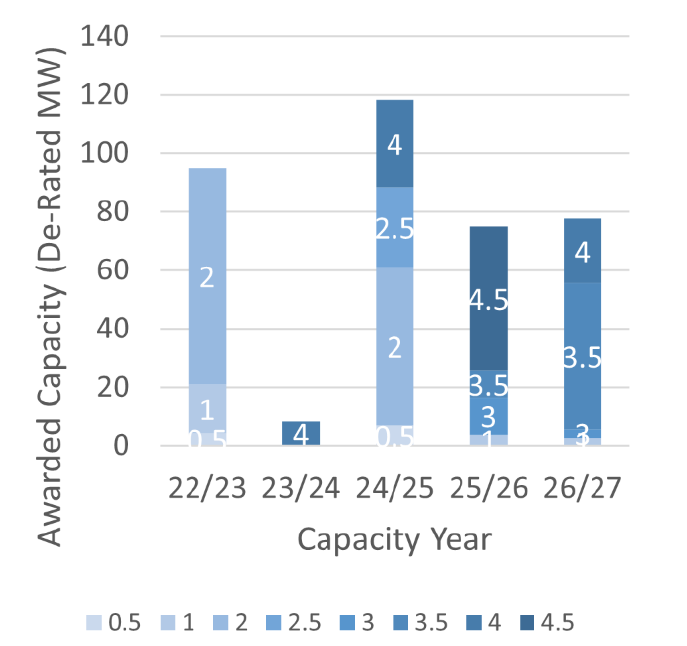
Figure 9 - Battery Storage - 10 year Awarded New Capacity by Capacity Year and by storage capacity in hours at full load (0.5 - 4.5)

4. Saturation Effect
As more and more capacity from a technology class connects to the system (or is expected to connect to the system in the timeframe), the marginal contribu-tion to reliability can decrease. This is particularly true for wind, solar, storage and demand side units, where their variable or energy limited nature means that adding further capacity of that technology class has limited or reduced value in terms of additional reliability.
Where the net demand curve is peakier, energy lim-ited units can increase system reliability by meeting the demand during these peaks. As LOLP is strongly related to available margin, where an energy lim-ited unit is available for the duration of the peak, it provides the same contribution to reliability as a unit that does not have an energy limit. Once there is sufficient capacity to meet the peaks in the net demand, additional energy limited capacity is assessed against the flatter parts of the net demand curve, which are longer in duration. As this occurs, the marginal de-rating factor for energy limited units will decrease in line with the amount of this broader demand profile that it can meet.
This is evident in Figure 8, the increased year-on-year commissioning of new batteries as set out in Figure 9 results in lower de-rating factors for smaller batteries and in combination with this and the size effect, de-rating factors for larger batteries of longer duration are significantly impacted.
Where a capacity adequate portfolio is comprised of units that do not have energy limits and the net demand is quite peaky, a marginal increase in demand will be absorbed by the capacity adequate port-folio in most periods as these periods would have had larger margins and very low LOLPs. As a result, the only periods that will see a material increase in LOLP will be around the peak periods. To the extent that an energy limited GX in Figure 3 can mitigate these periods of higher LOLP, it will benefit from a higher de-rating factor.
Where a capacity adequate portfolio is comprised of energy limited units only, and the net demand is quite peaky, it is likely that the capacity adequate portfolio includes enough energy limited units to fill out the net demand curve and no more. It is likely that the margin profile would be quite flat. In this case, a marginal increase in demand in all periods will increase LOLP in all periods. An energy limited GX in these circumstances cannot mitigate all these increases and therefore is likely to be de-rated more significantly.
As the capacity of storage and other energy limited units such as demand side units increase, they tend to make the LOLPs less peaky decreasing the value of storage and other energy limited units such as demand side units and discourages further investment. In this way, investment in batteries and demand side units will increase where wind and solar drive increases in the peakiness of the net demand. Once this peakiness, has been filled in by energy limited units, the incentive to invest further decreases. Thus, de-rating factors can be seen to moderate investment where there is sufficient energy limited capacity to fill out the peakiness of the net demand, which is driven by levels of wind and solar. This effect goes both ways as we will see in the next paragraphs.
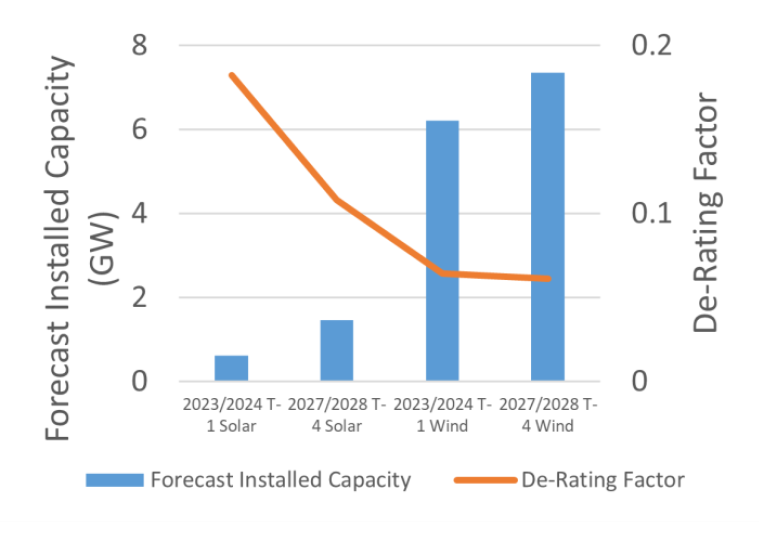
Figure 10 - impact of installed capacity on de-rating factor
It has long been established that the contri-bution of variable renewables to reliability decreases as the penetration of the renewa-ble resource increases (all other things be-ing equal). Figure 10 shows the de-rating factors associated with wind and solar for the 2023/2024 T-1 and 2027/2028 T-4 Ca-pacity Auctions and the amount of each re-source expected for each of the capacity years. As the amount of the variable re-source increases, its de-rating factor de-creases.
It can be seen that solar (which is at reason-ably early stages of growth in Ireland and Northern Ireland) benefits from quite high de-rating factors. Somewhat surprisingly, for the 2023/2024 T-1 Capacity Auction, the de-rating factor for solar exceeds the capacity factor of solar. This is due to the fact that when solar generates in this period, it coincides with periods of higher LOLP (e.g. due to scheduled outages during the summer period). Once the amount of solar increases to higher levels, we see this effect reducing as the saturation effect begins to dominate.
Saturation is also clearly evident in the case of wind generation where additional wind generation does little to mitigate higher LOLPs from an increase in demand. This is not surprising as a significant driver of higher LOLP periods would be the lack of wind generation in these periods.
Investment in new wind and solar generation in Ireland and Northern Ireland tends to be driven by renewable support schemes. Renewable generators do participate in the capacity market, where they are no longer in receipt of support or where there are no current support options available. As discussed in respect of energy limited units such as storage and demand side units, the peakiness of the net demand influences the de-rating factor of the marginal energy limited unit. Similarly, storage and demand side units can increase the demand during high wind or solar periods (which should occur naturally in re-sponse to price). Where this occurs, the de-rating factors of wind and solar will increase. On this basis, the parallel development of variable resources such as wind and solar and demand modifying resources such as batteries and demand side may mitigate the saturation effect.
5. Conclusion
Representing demand as net demand in LOLP and de-rating calculations represents a profoundly differ-ent approach to assessing system reliability. As always, using historical data as being representative of likely future outcomes is precarious (in particular where weather patterns are being disrupted) and great care needs to be taken that scenarios used capture the likely variations of demand, wind and solar levels and profiles.
Based evidence included here, there is evidence to suggest a high degree of correlation between the shape of net demand duration curves over recent years, which are the main drivers of LOLP. As wind and solar increase on the system, with a net demand approach, LOLP profiles tend to be peakier thereby increasing the value of energy limited resources such as storage and demand side units, which benefit more from peaky LOLP profiles. This promotes further investment in storage and demand side capacity as installed variable renewables increases.
Representing all forms of capacity using an ELCC approach is critical to ensure that there is a level playing field and that contribution of all units to reliability is not overstated. An example of this can be seen in how the magnitude of the installed capacity of a unit impacts the de-rating factor of the unit in Ireland and Northern Ireland. This reflects a diseconomy of scale for larger units and promotes right sizing of resources relative to the size of the system.
All of these effects reflect changing dynamic physical effects on the power system and the way each effect evolves and interplays with the other effects gives rise to the de-rating factors in a particular year. Reflecting the fundamentals of a reliable power system in long-term market signals is critical to pro-moting the necessary investment in the different technologies required to integrate massive amounts of variable renewables. In this way, storage, demand side units, interconnection are enablers of operation with ever greater levels of wind and solar and vice versa. De-rating factors are the key measure to incentivise the appropriate levels of investment in mutually beneficial technologies as we transition to-wards net zero.
Acknowledgments
This paper benefits from work carried out by the Capacity Requirement and De-Rating Factor team in EirGrid and SONI over the period from 2015 to 2023 including Robert Flanagan, Philip O’Donnell, Frederick Kruger, Eoin Clifford, David McGowan, Dan Keogh, Jiawei Zhao, Peter Jackson, Sean O’Brien, Kunle Alao, Marc Senouci, Mike Belcher, Gareth McLorn, Marc Curran, Seamus Power and Shane Maher.
References
- EirGrid, SONI, “Shaping our electricity future roadmap v1.1,” (July 2023), online
- EirGrid, SONI, “Final Capacity Auction Results (FCAR)” for Capacity Years 18/19 until 26/27, online
- EirGrid, SONI, “Capacity Market: A Helicopter Guide to understanding the Capacity Market,” (March 2019). Online
- L. L. Garver, "Effective Load Carrying Capability of Generating Units," (IEEE Transactions on Power Apparatus and Systems, vol. PAS-85, no. 8, pp. 910-919, Aug. 1966), doi: 10.1109/TPAS.1966.291652.
- N. Schlag, Z. Ming, A. Olson, L. Alagappan, B. Carron, K. Steinberger, and H. Jiang, "Capacity and Reliability Planning in the Era of Decarbonization: Practical Application of Effective Load Carrying Capability in Resource Adequacy," (Energy and Environmental Economics, Inc., Aug. 2020)
- S.A. Newell, K. Spees, J. Higham, “Capacity Resource Accreditation for New England’s Clean Energy Transition – Report 2: Options for New England,” (June 2022). Online
- EirGrid, SONI, “Methodology for the Calculation of the Capacity Requirement and De-Rating Factors,” (June 2018), online
- EirGrid, SONI, "Proposed Methodology for determining auction capacity requirements and de-rating factors", (Oct 2022). Online
- EirGrid, SONI, "Ten Year Generation Capacity Statement 2023-2032," (Jan 2024), https://cms.eirgrid.ie/sites/default/files/publications/19035-EirGrid-Generation-Capacity-State-ment-Combined-2023-V5-Jan-2024.pdf
- EirGrid, SONI, "2023/2024 T-1 Capacity Auction Initial Auction Information Pack IAIP2324T-1,", (Dec 2022). Online
- EirGrid, SONI, "2027/2028 T-4 Capacity Auction Initial Auction Information Pack IAIP2728T-4," (Mar 2023), online
- A. Lovins, "Small is Profitable. The Hidden Economic Benefits of Making Electrical Resources the Right Size," (Rocky Mountain Institute, 2002), online
