Synchronous Grid-Forming Control Interoperability in MTDC Systems
Authors
Taoufik QORIA - GE Vernova Grid Solutions, Germany
Carl BARKER - GE Vernova Grid Solutions, UK

Summary
Currently, most High Voltage Direct Current (HVDC) connections utilize a point-to-point configuration. To enhance future DC network power transmission flexibility, these systems need to evolve into Multiterminal DC (MTDC) systems. The development of DC grids demands sophisticated control strategies to support the hybrid AC/DC power systems and ensure their stability. This paper presents an analysis of a radial three-terminal MTDC system, using the Synchronous Grid-forming (SGFM) control concept. The SGFM control is examined in two modes—power control and DC voltage—each paired with a DC primary droop control. The objective is to assess and emphasize the advantages and limitations of each control mode for prospective MTDC grids. Additionally, due to the absence of inherent inertia in DC systems, Dynamic Braking Systems (DBS) are crucial for mitigating DC overvoltage. Unlike conventional point-to-point onshore-offshore configurations, which employ a single DBS, MTDC grids can incorporate multiple DBSs, necessitating proper coordination to prevent adverse interactions that may cause instability. This paper proposes and investigates a coordination strategy based on AC fault location.
Keywords
Multiterminal Direct Current, High Voltage Direct Current, Synchronous Grid-forming, Constrained Synchronous Grid-forming, Dynamic Braking System, Interoperability1. Introduction
The ongoing increase of Renewable Energy Sources (RESs) and particularly wind power generation requires additional infrastructures, mainly transmission systems through High Voltage Direct Current (HVDC) equipment. Nowadays, most of the HVDC connections are based on point-to-point configuration. The latter must be expanded to Multiterminal DC (MTDC) systems to allow for future DC network power transmission flexibility. Yet, the expansion of DC grids compared to point-to-point HVDC requires advanced control strategies to ensure DC voltage stability, power flow management to guarantee the power balance and fault resilience for fast fault isolation and recovery.
MTDC grids can be more challenging when associating multi-vendor equipment as well as using different control and coordination strategies for the different units, such as for converter stations, and Dynamic Breaking Systems (DBS) [1].
In MTDC systems, the bipole converter station configurations are expected to be the most suitable state-of-the-art solution to increase the availability of power production and the flexibility to switch modes in case of faults on the Dedicated Metallic Return (DMR) or a HV pole conductor. The onshore converter stations are typically associated with a DBS unit, which is a critical protection mechanism in DC grids to prevent sudden load rejection of the power source in case of AC grid faults. With analogy to the AC system where the frequency variations are limited by the natural inertia, the DC grids lack inertia making fast DC overvoltage control essential.
Focusing on control aspects:
- Synchronous grid-forming (SGFM) [2] strategies for onshore stations are highly desired by system operators thanks to their abilities to enhance system stability and provide inherent contribution from the power electronic devices to support the power system. The natural reaction of power converters based on SGFM to AC and DC disturbances creates a strong coupling between AC and DC sides of the converter making the control interoperability issues highly probable. The combination of the different control modes in a DC grid would have stability and dynamic implications on the overall system operation, which has not been discussed in prior art, i.e., most of the existing works on the SGFM control in HVDC applications are dealing with point-to-point configurations, where SGFM converters are controlling the power assuming a DC energy availability or controlling the DC voltage assuming very limited inertia provision. However, the implications of the SGFM control in MTDC systems considering the DC voltage primary control with different implementations have not been addressed.
- DBS control is conceptually very simple. It consists in limiting the DC voltage by dissipating the power in a braking resistor. In a point-to-point onshore-offshore configuration, only one DBS unit is used with a fixed threshold of overvoltage triggering operation. This methodology might not be effective anymore for MTDC systems, where several DBSs are used, and which require adequate coordination.
To fill the literature gaps, this paper intends to evaluate the stability and dynamic performance of a radial three terminal MTDC system. SGFM controllers in different control modes associated with the DC primary droop control are evaluated to highlight their impact, benefits and challenges for future MTDC grid. Moreover, a DBS coordination solution based on AC fault location is investigated in this paper, where the DBS associated with the converter station sensing AC fault is preferably activated by dynamically changing the DBS voltage action threshold. The system performance is assessed through time domain simulations, where small and large disturbances are tested.
2. System Description
2.1. Radial Three-Terminal DC System
The studied system is shown in Figure 1. It is based on a radial three-terminal DC system with two onshore grids and one offshore grid.
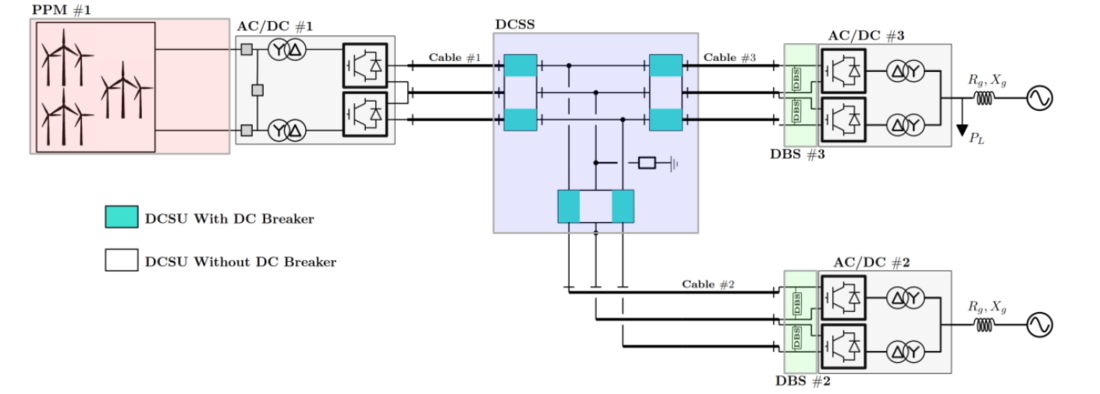
Figure 1 – Studied HVDC System
The MTDC system consists of the following subsystems depicted in Figure 1:
- Three AC/DC converter bipole stations connected to the AC system through Y/Δ power transformers. Each converter is based on the Modular Multilevel Converter (MMC) technology modelled with as type 6 referring to [5]. The converter units are coupled at the onshore and can also be coupled at the offshore side using the pole coupler, which are closed in this work.
- Two DBS stations (two DBS units for each station) located at the onshore converter stations.
- One central DC Switching Stations (DCSS) that consists of three DC switching units (DCSU) per pole with Fault Separation Devices (FSDs). Since DC protection aspects are out of the scope of this paper, only the DC reactors of FSDs are considered as they have an impact on the system dynamic performance.
- Two onshore AC systems modelled with Thévenin equivalent in series with an equivalent impedance ??, ?? defining the grid strength. AC side associated to the converter station #3 has ?? in addition connected at the point of common coupling (PCC), which will be used to assess the islanding mode.
- One offshore connecting the DC Power Park Module #1 (DC-PPM), where the windfarms are controlled using typical grid-following (GFL) concept.
On the DC side, three cables #1-2-3 are used and modelled based on Frequency-dependent cascaded pi-model given [6]. The system grounding is located at the DCSS.
2.2. AC/DC Converter Station
Figure 2 illustrates the AC/DC converter station, and its associated AC and DC boundaries. The electrical quantities depicted in Figure 2, ,
,
,
,
,
,
and
denote respectively the positive DC voltages and currents, the negative DC voltages and currents, the instantaneous converter AC voltages and AC currents, and instantaneous AC grid voltages and AC currents at AC-PoC. The subscript “?" defines the converter number, e.g., “1” refers to AC/DC converter #1.Figure 2 illustrates the AC/DC converter station, and its associated AC and DC boundaries. The electrical quantities depicted in Figure 2, ?????, ?????, ?????, ?????, ??? , ??? , ??? and ??? denote respectively the positive DC voltages and currents, the negative DC voltages and currents, the instantaneous converter AC voltages and AC currents, and instantaneous AC grid voltages and AC currents at AC-PoC. The subscript “?" defines the converter number, e.g., “1” refers to AC/DC converter #1.
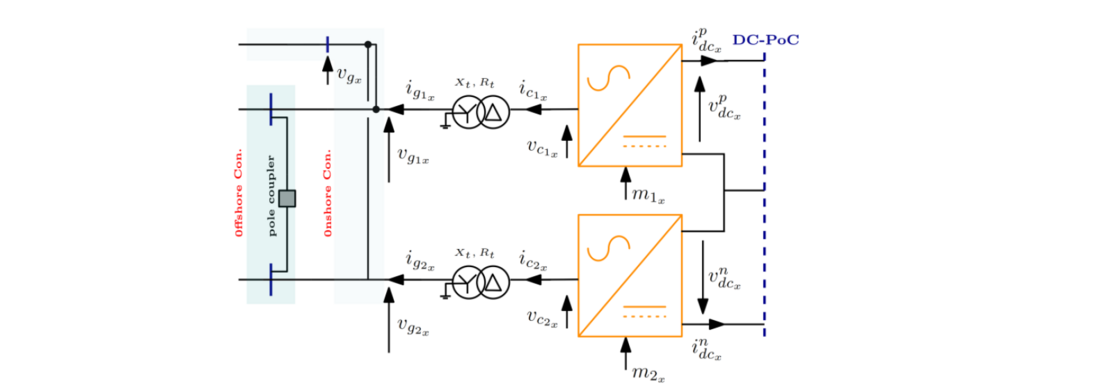
Figure 2 – AC/DC converter Station
2.3. Dynamic Breaking System
DBS includes a controllable device assembly regardless of the type of the DBS. The valve assembly may assume different designs and arrangements and may include passive elements for instance capacitors or other energy storage elements. The dynamic breaking resistor may assume different designs and may include several resistors connected in series or in series-parallel to fulfil the energy dissipation. A simplified DBS representation is given in Figure 3.

Figure 3 – Dynamic Breaking System
3. Control Modes Description
3.1. Primary Local DC Voltage Control
The primary DC voltage droop control is typically defined as the ratio of a steady-state deviation of DC voltage to the steady-state change in the active power output. It is used in different converter stations to share the DC voltage control efforts. The larger the DC voltage deviates from the reference value, the larger the differences between power.
Two major type of DC droops can be found in the literature: ???−??? or ???−?. In this paper the power-based control is considered and given by the following expression:
(1)
Similarly to the frequency droop control, the DC voltage droop control can be implemented in two different ways illustrated in Figure 4. The implementation in Figure 4.a is associated with the DC voltage control, where the second implementation in Figure 4.b is associated with the active power Controller.
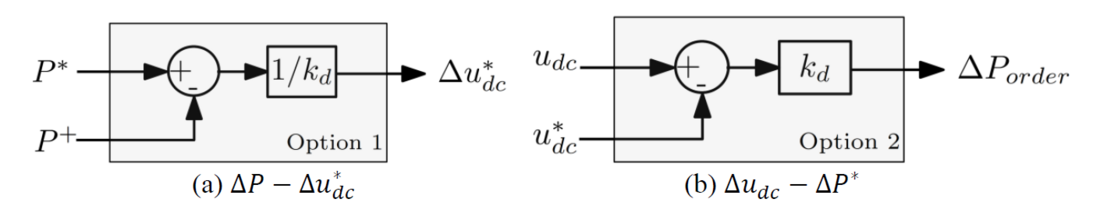
Figure 4 – DC Droop Control Implementation
3.2. Synchronous Grid-Forming Local Control
SGFM referring to [7] is defining the functional behavior of a converter unit as a controlled voltage source behind an impedance. This property shall be maintained by the AC/DC converter if the HVDC system is operating within the limits (voltage, current and energy). This definition is associated to the SGFM power control mode [8], which needs to deliver the following services to the power system:
- Self-Synchronization Capability
- Phase Jump Active Power
- Inertia Active Power
- Inherent Reactive Power Injection
Controllers such as droop control [9], virtual synchronous machine [10], etc. have already been proposed in the literature to comply with the requirements listed above. In this paper the solution used for controlling the power is shown in Figure 5.a and detailed in [3], [11]. The DC voltage limiting function detailed in [12] is not implemented in this study to better illustrate the inherent behaviour of the controller.
SGFM power control-based comprises the following vital functionalities:
- Advanced Active Power Controller [11].
- AC Voltage Controller.
- Current Limiting Function [13].
- Frequency Droop Control
If the SGFM functionality is set to control the DC voltage, the DC voltage controller must oppose the inertial effect to keep the DC voltage within the operational band, since the DC system has no natural inertia such as the AC system. In this sense, the internal phasor angle variation should be fast enough to avoid significant DC voltage deviations. This is, in a way, in contradiction to the definition given to the typical SGFM. Therefore, this control mode is defined in this paper as Constrained-SGFM (C-SGFM), and should deliver the following services to the power system:
- Self-synchronization Capability
- Limited Phase Jump Active Power
- Limited Inertia Active Power
- Inherent Reactive Power Injection
C-SGFM control-based is illustrated in Figure 5.b and comprises the following vital functionalities, which are detailed in [3]:
- DC Voltage Controller [3].
- AC Voltage Controller.
- Current Limiting Function [13].
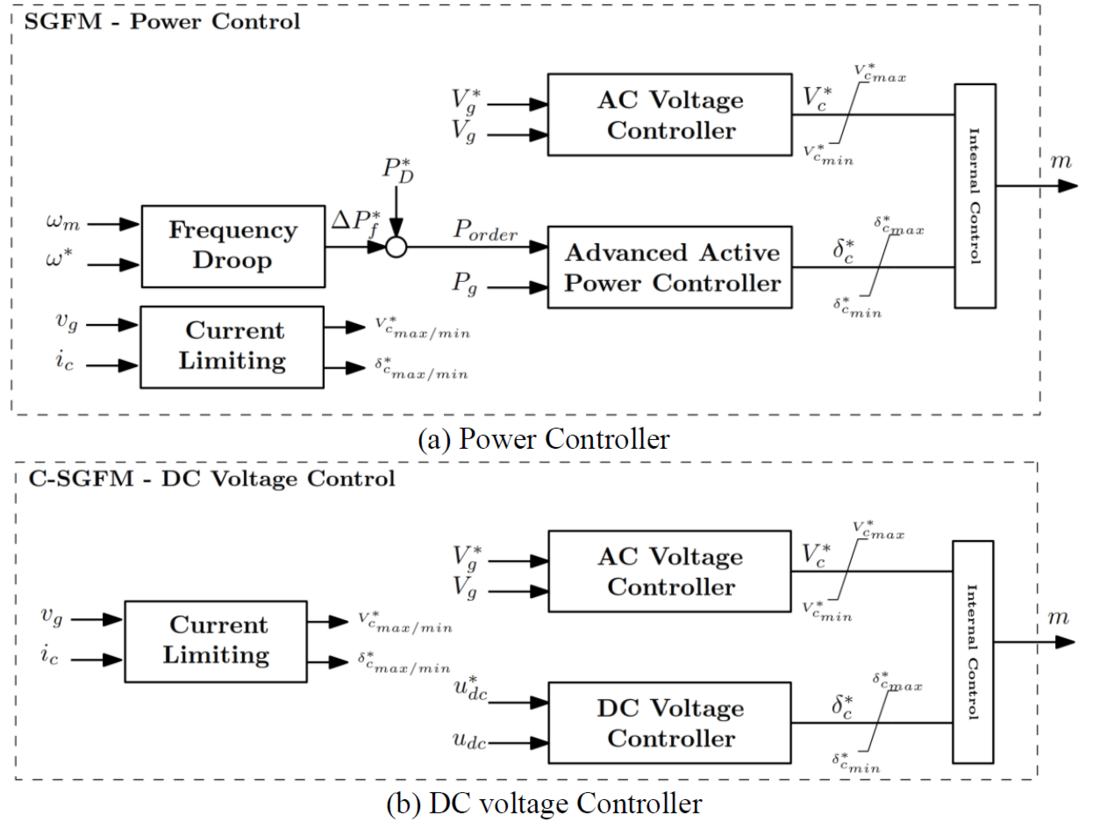
Figure 5 – SGFM and C-SGFM Controllers
3.3. Grid-Forming Local Control
Using GFM control, the deblocked converter at the offshore station acts as a stiff voltage source behind an impedance [9], [14]. Under this operating control mode, the converter controls the instantaneous voltage seen from the AC grid PoC for balanced and unbalanced loads as long as the resultant vector of the measured currents are below the predefined limits.
During large disturbances, if the AC current exceeds the current capability of the converter, the converter voltage switches to the current limiting mode to protect the converter. The GFM control is shown in Figure 6.
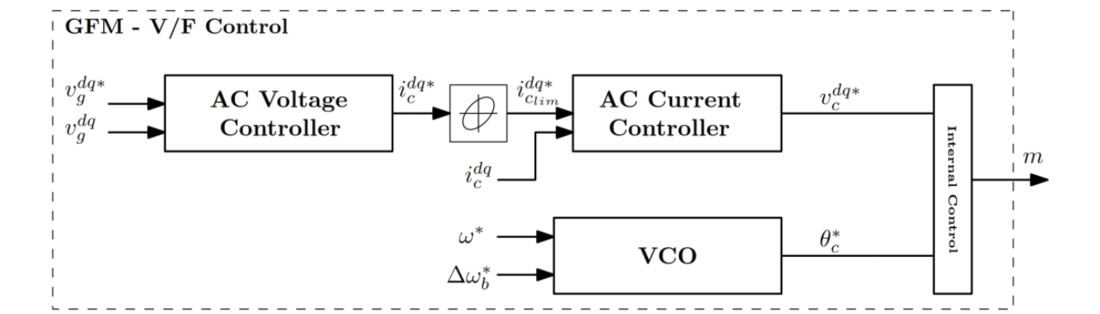
Figure 6 – GFM Controllers
In addition to the frequency reference ?∗, a is generated by the pole balancing control, implemented within the bipole controller. It is used to modulate the frequency in order to allow for power sharing among the poles when the pole coupler is closed. Different strategies for balancing the power can be found and are well summarized in [4].
3.4. DBS Coordination
The two DBS stations connected at different locations on the onshore connection points of the MTDC system shall be coordinated to support the primary response and keep the system within operational security limits. One method to achieve DBSs coordination is to set the DC overvoltage threshold as:
(2)
where “?” refers to the DC bus index in the HVDC system.
During a large disturbance within the AC grid associated with one of the onshore converter nodes, the threshold of the associated DBS at that node is reduced to ????,? (i.e. Δ????,?=0) to dissipate the excess energy. The other node will have higher triggering voltage level and will act only in case the DBS associated with the disturbance station fails to operate.
4. Evaluation of the MTDC system operation
In this section, the overall dynamic and transient performance are assessed considering relevant test cases given as a matrix in Table 1.
| Control Mode | Cable Length | Grid Strength | Test Scenarios |
|---|---|---|---|
| Scenario I Conv1: GFM Conv2: SGFM P-Vdc droop Conv3: SGFM P-Vdc droop | Cable #1: 150 km Cable #2: 50 km Cable #3: 50 km | SCR_Onsh_3 = 1.9 SCR_Onsh_2= 2 | 1-Active Power change 2-DC voltage change 3-Phase jump 4-Three-phase Fault |
| Scenario II Conv1: GFM Conv2: SGFM P-Vdc droop Conv3: SGFM Vdc-P droop | Cable #1: 150 km Cable #2: 50 km Cable #3: 50 km | SCR_Onsh_3= 1.9 SCR_Onsh_2 = 2 | 1-Active Power change 2-DC voltage change 3-Phase jump 4-Three-phase Fault 5- Islanding |
The main system and control parameters are listed in Table 2.
| Parameters | Definition | Value |
|---|---|---|
| Pn | Nominal Active Power of each Station | 2000 MW |
| Pb | Active Power Base | 1000 MW |
| Onshore RMS phase-phase AC voltage Base | 400 kV | |
| Offshore RMS phase-phase AC voltage Base | 66 kV | |
| fb | AC frequency | 50 Hz |
| TSGFM–P | Inertia time constant TSGFM−P=2?SGFM−P for power controller | 25s |
| TSGFM–Vdc | Inertia time constant for DC voltage controller | <1s |
In Table 1, scenario I, is evaluating the C-SGFM associated with the primary DC droop control in Figure 4.a implemented for both onshore stations. Scenario II evaluates the combination of the SGFM associated with the DC primary control in Figure 4.b and C-SGFM associated with the primary DC droop control in Figure 4.a.
In the following, the test cases are presented simultaneously for scenario I and scenario II. The plotted signals are given in per-unit and chosen with respect to their relevance to the test case.
4.1. Active Power Change
In Figure 7.a and Figure 7.b, at -1 p.u. power injection from the DC PPM is applied at ? =1.6 ? with a ramp rate of 0.5 p.u./s. The signals plotted are the measured AC active power of one pole at each converter station ?11,?12,?13, and the DC voltages measured at ±HV poles of each converter station ,
,
,
,
,
.
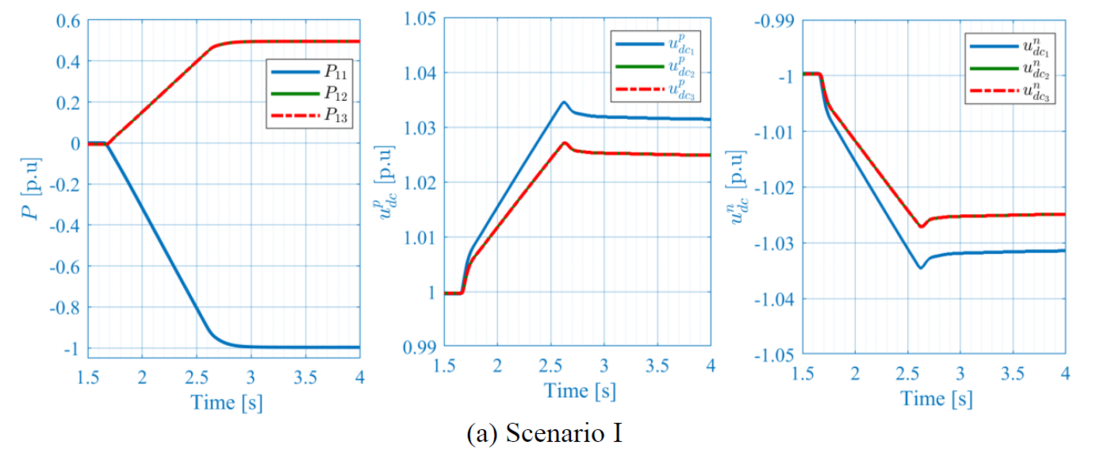
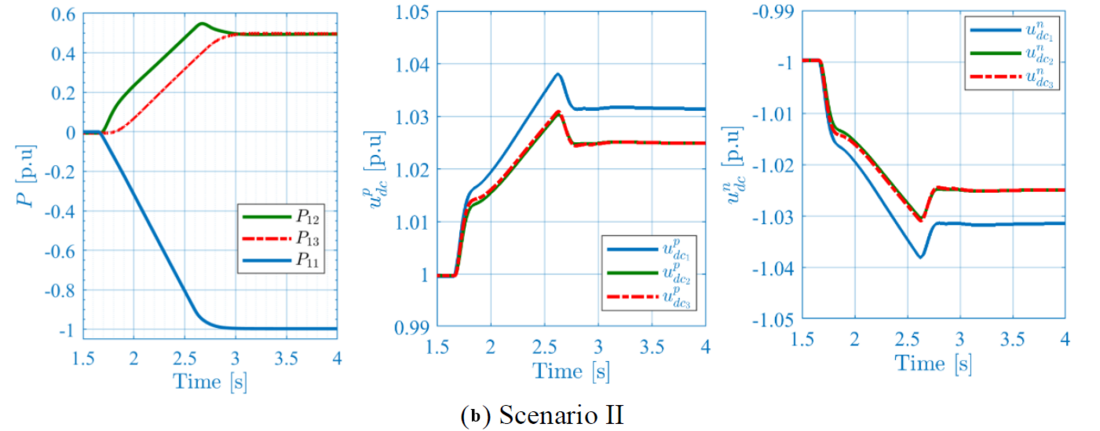
Figure 7 – Windfarms Power injection
It can be observed that the system is stably reaching the new operating point for both scenarios, where the power is perfectly shared in steady state due to the identical distance between the onshore converter stations and the power source, as well as the identical droop gains of 5%. From a dynamic perspective, scenario I shows identical responses of the active powers and DC voltages during the ramp up phase, which is somehow expected because both stations are using identical control solution. This is not the case with scenario II, where different controls are used with different implementations of the primary DC voltage control. One can notice that station #3 based on active power control is slower than station #2 based on DC voltage control due to the inertia effect. This difference implies more constraints on station #2, that receives more power during the ramp up phase, and therefore, engenders a higher DC voltage (e.g. =1.026 p.u. for scenario I, and (e.g.
=1.03 p.u. for scenario II).
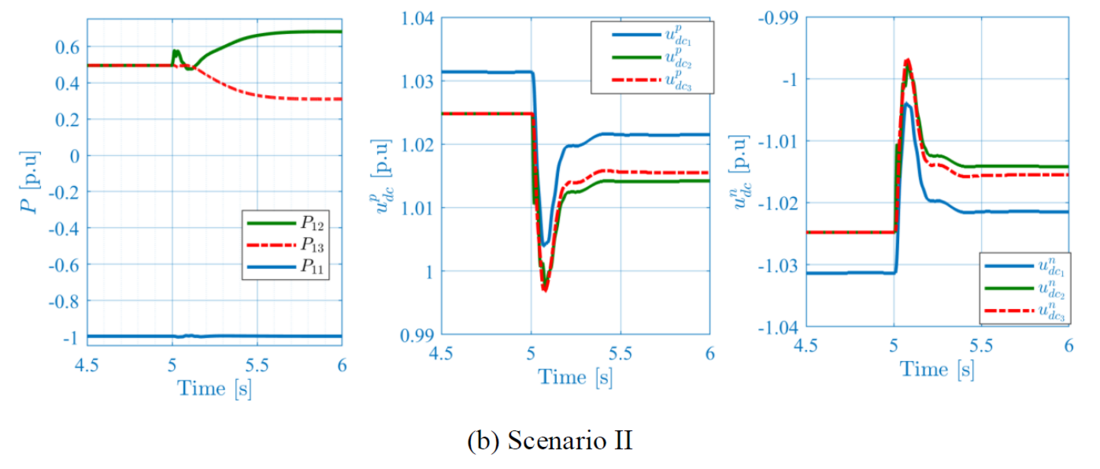
4.2. DC Voltage Change
In practice, any change on the DC grid configuration or on the power flow requires a definition of new setpoints for each converter station given by the DC grid controller, to keep, the DC voltage and the active power within the operational limits. In this subsection, a DC voltage change is manually applied at station #2 to reduce the voltage at the offshore converter end. In Figure 8.a and Figure 8.b, change of -0.02 p.u. is applied at ?=5 ?. Similar plots as for the previous test case are used. The obtained results, show a stable system operation after the small disturbance for both scenarios. The power sharing between station #2 and #3 has been changed due to the difference of the DC voltage operating point, where station #2 is receiving more power to support the DC voltage. These results are identical for both scenarios in steady state, however, in transient, it can be observed the DC voltage in scenario I is reaching the new operating point within less than 50 ms, due the fast response of the DC voltage controllers in both stations. Moreover, the system response presents an overshoot of 30%. In contrary to scenario I, scenario II shows different behaviors, i.e., due to the slow response of station #3, the DC voltage significantly drops before the reaction of the power-based station #3. In this case the voltage reaches the steady state within 400 ms and presents an overshoot of 150%.
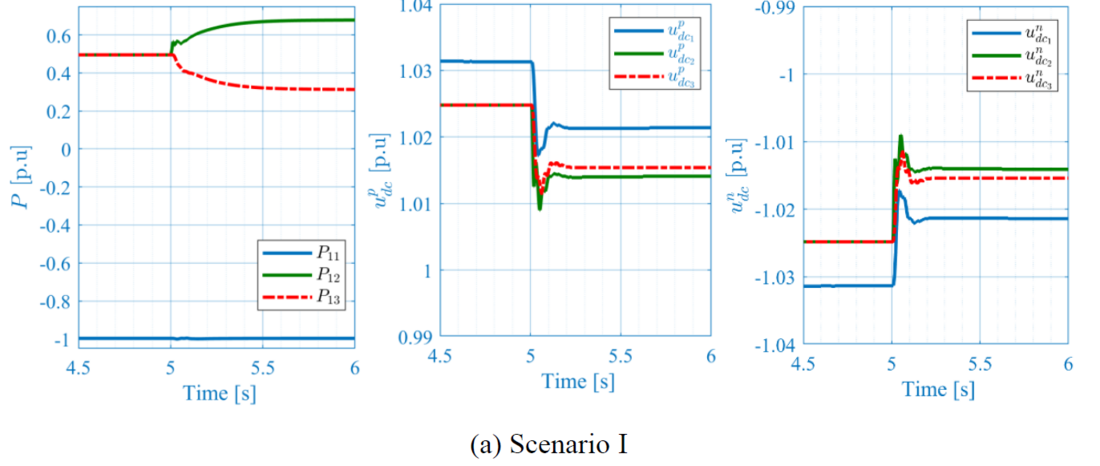
Figure 8 – DC voltage change in station #2
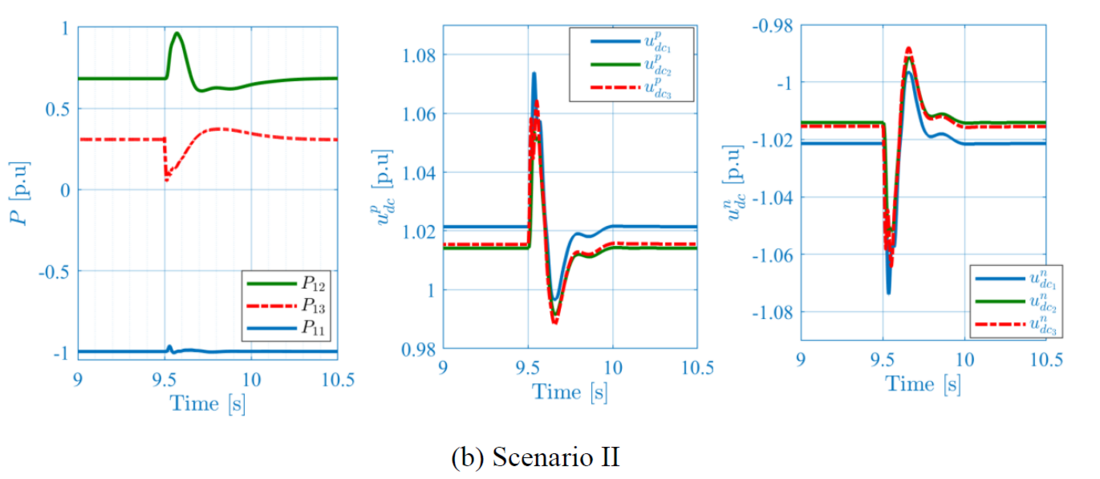
4.3. Phase Jump
This test case assesses the system response to the AC grid phase jump applied at station #3. In Figure 9.a and Figure 9.b, a 10° phase jump at ?= 9.5 s is applied. Similar plots as for the previous test case are used. In general, the system stably responds to the event. Note that, the impact of the phase jump is related to the inertia constant and the grid impedance. Since the C-SGFM inertia constant is negligible for both converter stations #2-#3, in scenario I, the contribution to the phase jump is limited compared to scenario II, where the inertia constant is significantly higher. The MTDC system is a high-power transmission infrastructure and not an energy buffer, hence, when a phase jump occurs the active power requested is delivered by the other end with a certain delay caused by the inductances limiting the . Therefore, the energy difference during the first transients can only be delivered by the cable and by the internal energy of the converter itself. This can be noticed in both scenarios, where the voltage DC increase is limited to 1.05 p.u. in scenario I and to 1.07 p.u. in scenario II.
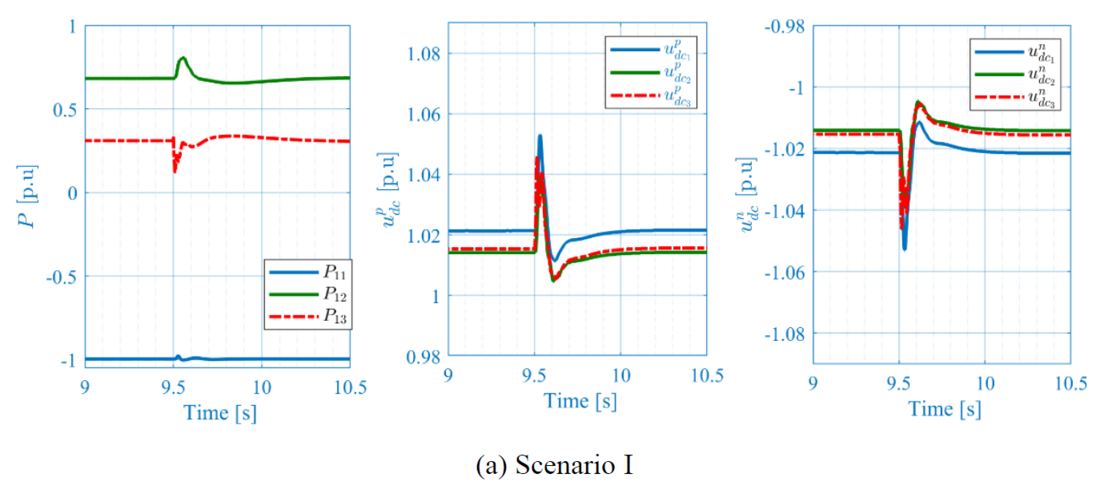
Figure 9 – Phase Jump at station #3
4.4. Three-phase bolted fault
In this use case, a 250 ms three-phase bolted fault is applied at the PCC of station #3 at t = 11.5 s, and of station #2 at t = 15.5 s.
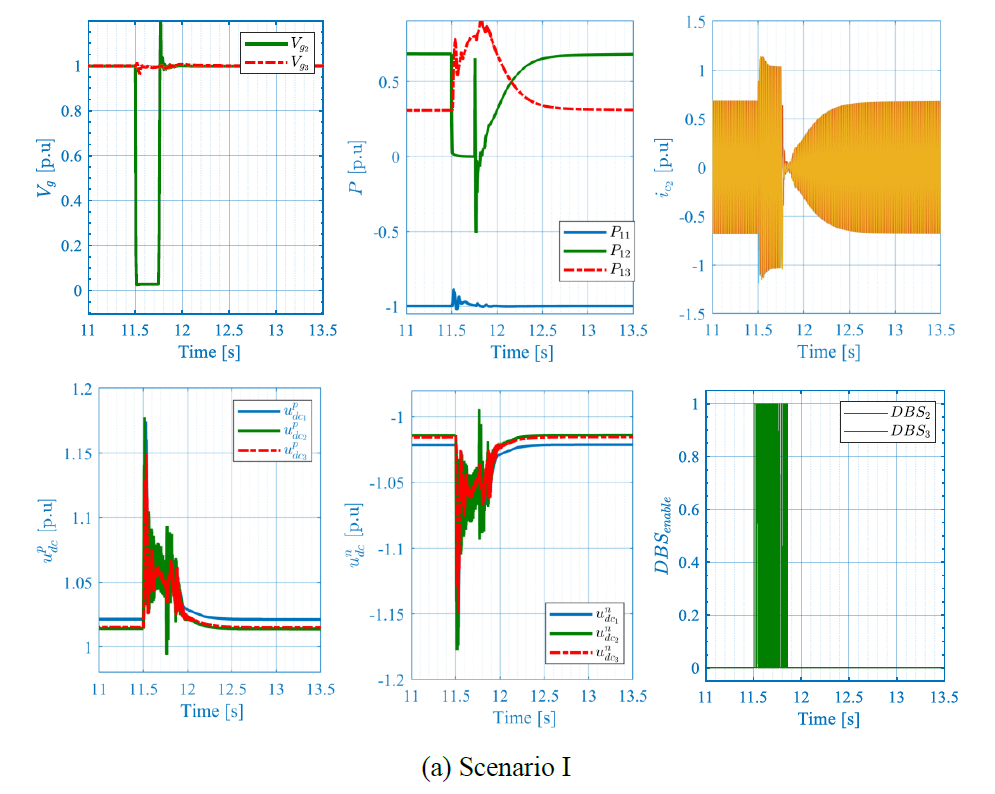
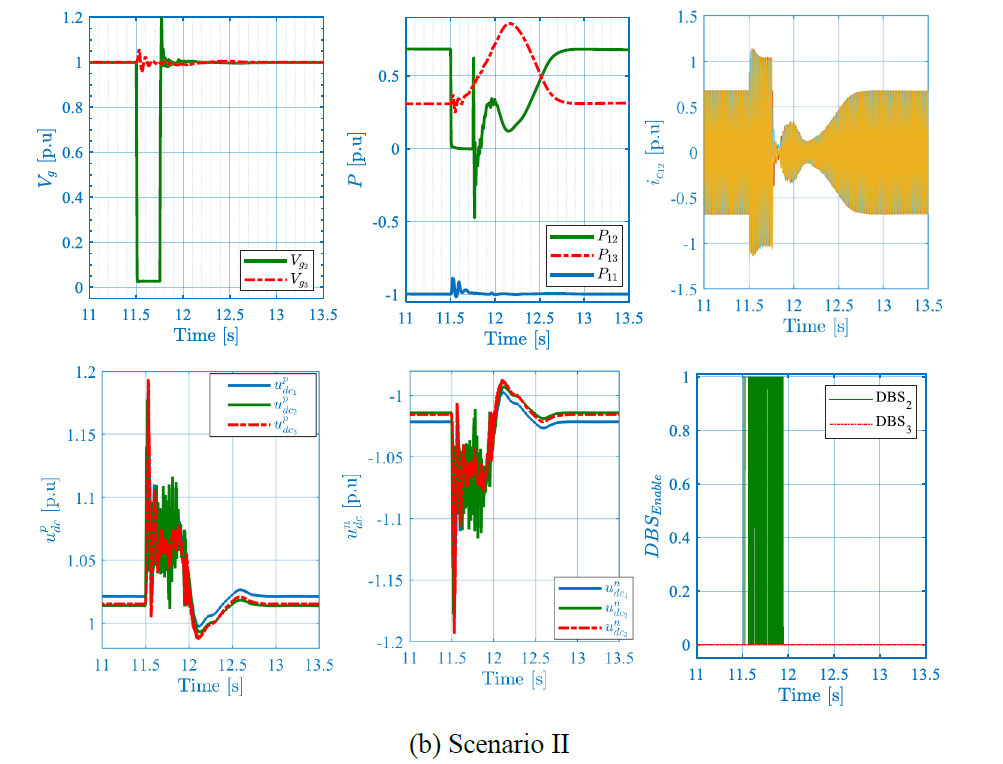
Figure 10 – 250ms Three-phase bolted fault at station #3
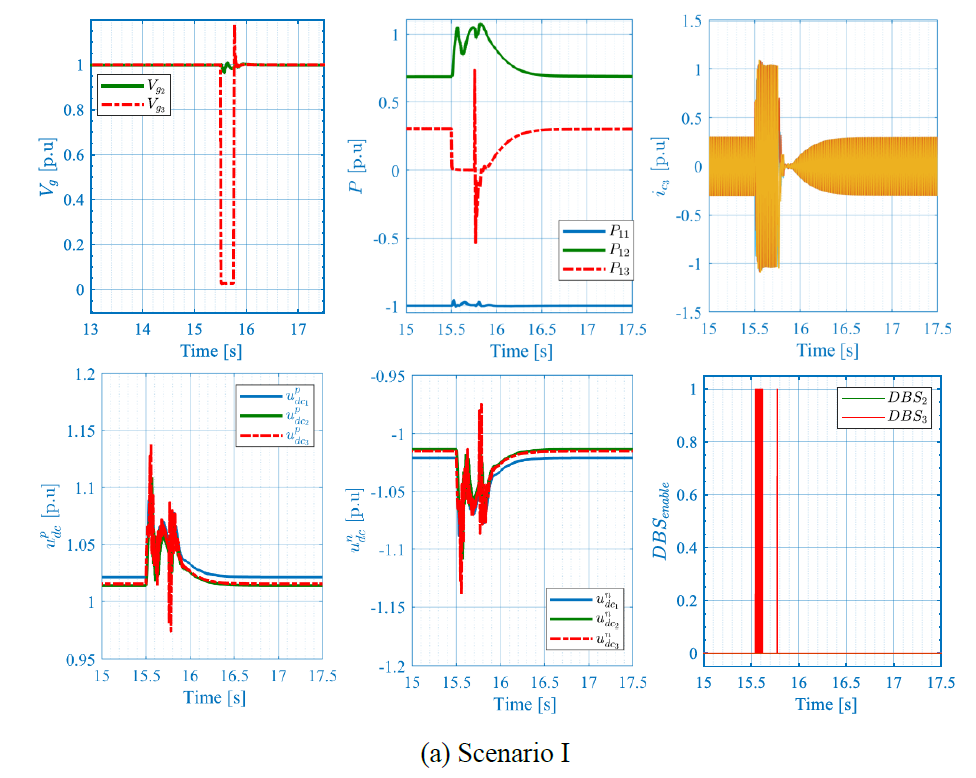
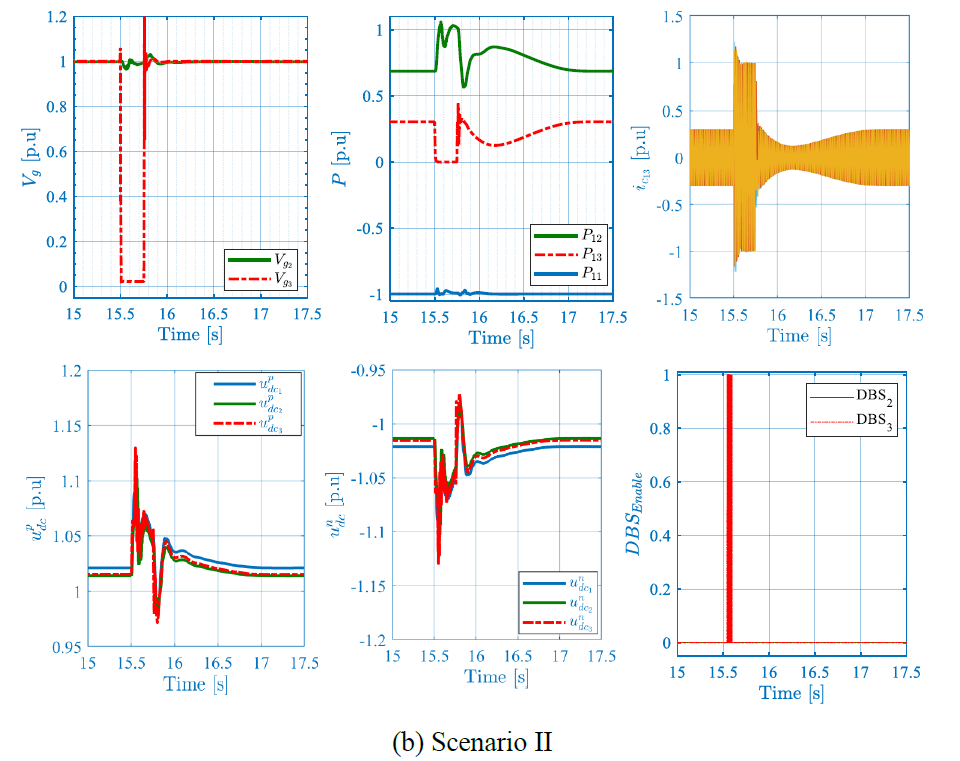
Figure 11 – 250ms Three-phase bolted fault at station #2
The results are presented in Figure 10 and Figure 11 showing the converter currents ??, the active power ?, the AC voltage magnitude ?? , the DC voltages ???, and the DBS activation signals. For both scenarios, the fault engenders AC voltage drop, which yields an AC current increase that is curbed by the current limitation functionality. During the fault, DC voltage increases leading to the DBS activation and hence DC voltage limitation and power dissipation. Note that interestingly, and thanks to the proposed DBS coordination method, only DBS located at the faulty end is activated, whereas the other DBSs remain deactivated. Once the fault is cleared, the system stably recovers its equilibrium point. In scenario II, where the fault is applied at station 2, the active power recovery takes around 750ms to recover its equilibrium point compared to scenario I, where it recovers within 500ms.
4.5. Islanding mode
This test case is only applicable in scenario II; to the station based on the active power controller. The goal of this test case is to show the ability of the control to remain stable and highlight its impact on overall system response. Initially, a ????? = 200 MW is connected at PCC of converter station #3, and the frequency droop control is enabled. At 6.5 s, the AC grid is disconnected driving the system to the islanding condition. The results are given in Figure 12, showing the active powers ? , the internal frequencies of the converters ? , and the DC voltages ???. During the pre-event phase, the load is fed by the AC grid, once the latter is disconnected, the load is fed by converter station #3, resulting in its frequency change that depends not only on the frequency droop gain ?, but also to the primary DC voltage droop that modulates the power order. During the islanding situation, the DC voltage control is fully handled by station #2. In general, the control system properly handles the disturbance and drives the system to its new stable equilibrium point.
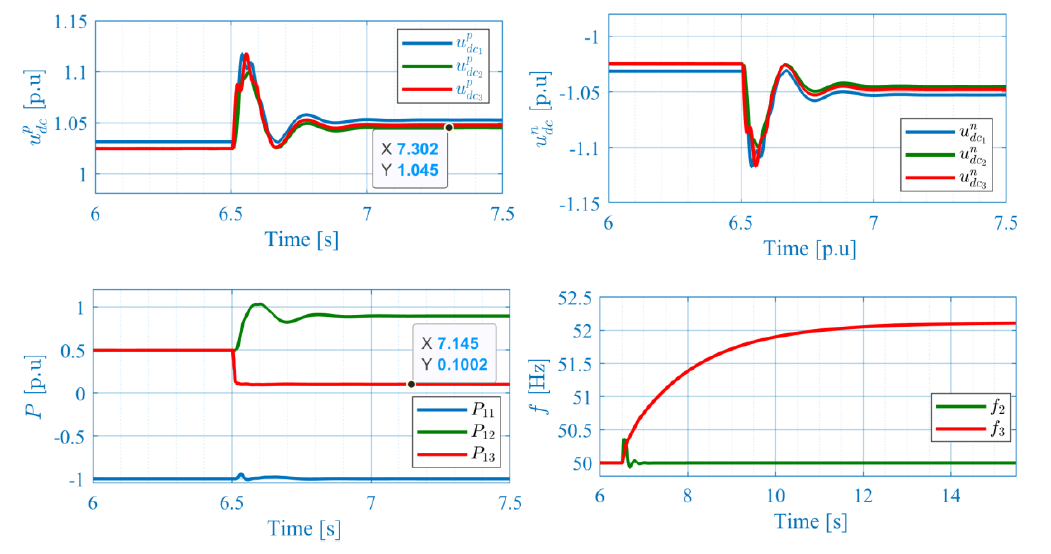
Figure 12 – Islanding mode
Conclusions
The study detailed in this paper has validated the effectiveness of both Constrained Synchronous Grid-forming (C-SGFM) and Synchronous Grid-forming (SGFM) controls as well as the DBS coordination strategy in maintaining the stability and operation of a basic Multiterminal DC (MTDC) system. Testing the C-SGFM across all onshore stations in various scenarios showed satisfactory performance on both the AC and DC sides; however, this control mode falls short in providing adequate inertial support to the AC system due to the rapid response of the inner DC voltage controller. An alternative setup combining SGFM and C-SGFM, incorporating DC primary control, was explored and yielded promising results. From a static and quasi-static standpoint, both controls aid in supporting the DC system. However, during transient conditions, the DC voltage-based control predominantly manages DC voltage regulation, especially if the inertia constant of the power control-based station is significant, which can result in considerable overshoot or undershoot in DC voltage and delayed dynamic response. Nevertheless, employing SGFM within the MTDC system has the benefit of supporting the AC system through inertia emulation contrary to a system solely reliant on C-SGFM. The inertia constant of the power controller can be further optimized to allow for a balance between AC and DC support, making the combined SGFM and C-SGFM configuration particularly appealing, and attractive for larger MTDC systems.
References
- ‘InterOpera -’. Accessed: May 06, 2025. [Online].
- TF-77, ‘AC Fault Response Options for VSC HVDC Converter’, CIGRE Science & Engineering, vol. Volume No.15, Oct. 2019.
- T. Qoria et al., ‘DC Slack Bus Control-Based Synchronous Grid-Forming for HVDC Applications’, CIGRE Canada, no. CIGRE-839, p. 8, Oct. 2024.
- F. Julian, Q. Taoufik, O. Jasim, C. Barker, S. Trivedi, and K. K. Math, ‘Power Pole Balancing Control Methods for HVDC Bipole Offshore Schemes’, ACDC, p. 6, 2025.
- CIGRE WG B4.57, ‘Guide for the Development of Models for HVDC Converters in a HVDC Grid’, WG B4.57, Technical Brochures ref. 604, 2014.
- J. Beerten, S. D’Arco, and J. A. Suul, ‘Frequency-dependent cable modelling for small-signal stability analysis of VSC-HVDC systems’, IET Gener. Transm. Distrib., vol. 10, no. 6, pp. 1370–1381, 2016
- ENTSO-E, ‘High Penetration of Power Electronic Interfaced Power Sources (HPoPEIPS), ENTSO-E Guidance document for national implementation for network codes on grid connection’, ENTSO-E, Mar. 2017.
- A. Adil et al., ‘Grid-Forming Functional Requirements for HVDC Converter Stations and DC-Connected PPMs in Multi-terminal Multi_vendor HVDC systems’, Jan. 2024.
- T. Qoria, X. Wang, and R. Kadri, ‘Grid-forming control VSC-based including current limitation and re-synchronization functions to deal with symmetrical and asymmetrical faults’, Electr. Power Syst. Res., vol. 223, p. 109647, Oct. 2023,
- H.-P. Beck and R. Hesse, ‘Virtual synchronous machine’, in 2007 9th International Conference on Electrical Power Quality and Utilisation, Oct. 2007, pp. 1–6.
- T. Qoria et al., ‘Dynamic Demand Control Applied to Synchronous Grid-Forming Controlled HVDC’, CIGRE Paris, ref. B4-10408-2024, p. 12, Aug. 2024.
- T. Qoria et al., ‘Synchronous Grid-Forming Power Controller for HVDC with Ancillary DC Voltage Limiting’, CIGRE Canada, no. CIGRE 839, p. 8, Oct. 2024.
- A. Adamczyk and C. Barker, ‘The Application of Synchronous Grid Forming Control with Current Limiting to HVDC’, CIGRE, no. B4-1101, p. 8, Sep. 2023.
- J. Freytes, J. Li, G. de Préville, and M. Thouvenin, ‘Grid-Forming Control with Current Limitation for MMC Under Unbalanced Fault Ride-Through’, IEEE Trans. Power Deliv., vol. 36, no. 3, pp. 1914–1916, Jun. 2021