Assessment of Structural Robustness for modern Gas-Insulated Switchgear in Offshore Substations
Authors
Edgar RAMOS CORDERO, Thilo NEHRING, Berty STEFFEN - Siemens Energy, Germany

Summary
As we move toward a net-zero emissions future, the development of offshore and onshore wind energy projects is decisive in substantially reducing carbon emissions. It is equally important that the equipment used in these projects minimizes environmental impact. Among the developments aiming to achieve this objective, we find novel Gas-Insulated Switchgear (GIS) that employs new interrupting technologies.
This paper focuses on the creation of a digital model for GIS using the Finite Element Method (FEM), and its validation through testing to reliably describe the structural dynamics of the system. We outline the research undertaken for the validation in the following chronological sequence: initial modelling attempt, model refinement via frequency search tests, stationary vibration tests, and shock tests. Ultimately, the model is employed to analyse seismic and offshore loads.
The necessity for such a model arises from the understanding that testing a single specimen from a product family is not sufficient for claiming compliance with the diverse technical requirements established by different standards and loading scenarios. The impracticality and economic constraints of testing every possible product configuration further reinforce this need. This is especially important in the examination of long-term oceanic conditions, where the potential for fatigue failure over lifespans exceeding 25 years is a concern. Determining the reliability of the model in predicting realistic behaviour is crucial in ensuring the resilience and durability of the equipment.
Keywords
Gas Insulated Switchgear, Offshore Wind, Finite Element Method, Vibrations, PSD, Shock, Fatigue1. Introduction
The advancement of switching technologies featuring environmentally friendly insulating media is progressing. In line with this trend, we have developed a compact gas-insulated switchgear utilizing 'clean air' insulation, comprising 80 % nitrogen and 20 % oxygen. Like all solutions in the industry, new technologies must adhere to the highest standards of technical performance. The challenges associated with new solutions arise from the necessity to substantiate their durability and robustness through sufficient evidence, which are key aspects for the overall resilience of the power grid.

Figure 1 – Overview of the newly developed Clean-air GIS
The robustness of the compact switchgear described in this paper is particularly critical because of its intended use in a wide range of environments, including offshore applications, seismically active zones, long and intensive transportation routes, and a diverse array of structures such as wind towers. Furthermore, the equipment's modularity allows for various physical configurations to meet the electrical and service requirements of different applications.
These factors introduce a spectrum of mechanical and structural stresses that must be thoroughly examined to confidently predict whether specific configurations and environments might lead to long-term failures under transport and marine-like conditions, or immediate failures because of short-term extreme events, such as earthquakes, which produce significant strong motions.
2. The engineering decision-making process and supporting models
In engineering, decision-making often relies on suitable, typically mathematical, models. These models are based on assumptions that influence the physical system's behaviour. Here, the engineer's intuition and experience are decisive, as the model's utility depends on its practical applicability and sophistication in yielding useful predictions.
Classical mathematical models are frequently too complex to solve exactly, requiring approximative solutions. The Finite Element Method (FEM) addresses this by simplifying the model into a mesh of finite elements and nodes, allowing for an approximate solution.
Evaluating a FE model involves quality control of the results, accounting for idealization and discretization errors. The model's assumptions and limitations are mirrored in the outcomes, emphasising the importance of validating results against empirical tests, a topic dealt with in subsequent paragraphs.
3. Finite Element model development
The strong formulation of an elastostatics problem is often impractical for rigorous solutions, particularly in complex three-dimensional models. The Finite Element Method (FEM) allows for the systematic solution of a weak formulation based on the virtual work principle, simplifying displacement function continuity requirements.
To approximate the displacement vector, the domain ? is divided into finite elements. Basis functions, defined locally and nonzero over individual or neighbouring elements, determine each element's complexity, computational cost, and solution quality.
Typical FEM outputs include stiffness matrices, mass matrices, load vectors, displacement vectors, and their domain-wide assemblages, all influenced by the chosen shape functions.
Our GIS FE model is designed to simulate complex stress states and three-dimensional structural dynamics under various loading conditions, to achieve this, we used a commercial FEM software with advanced element formulations, including quadratic shape functions, for solid mechanics verification (see Figure 2).
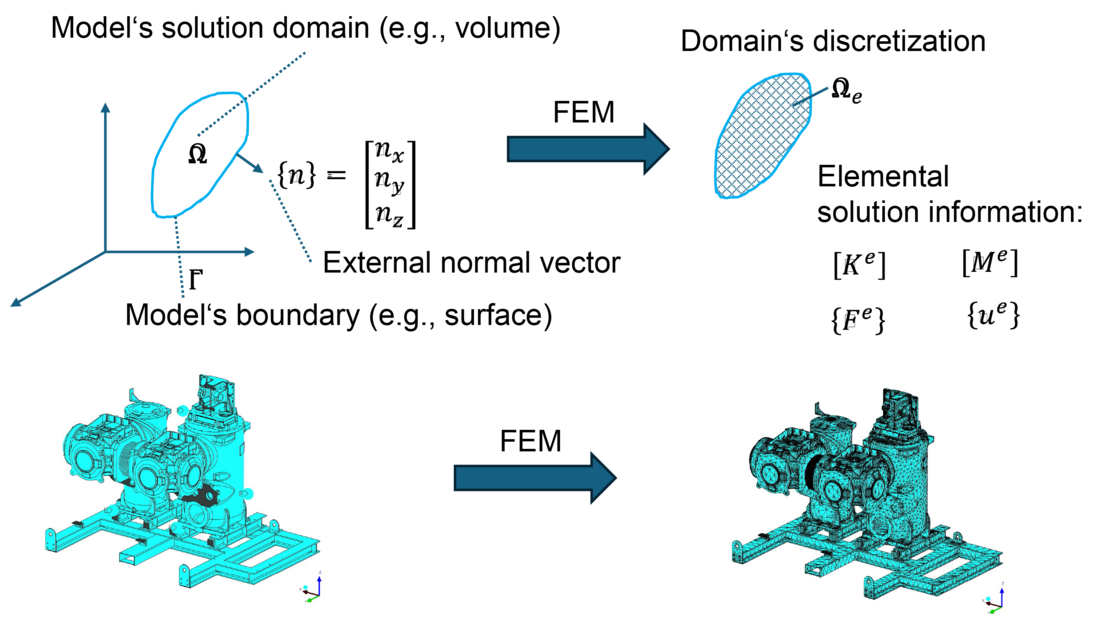
Figure 2 – Overview of the first Finite Element Model generated for the decision-making process
The clean-air GIS configuration modelled was selected based on an upcoming vibration and dynamics test campaign for a two-bay switchgear setup. Initially, control cabinets and cable connections were treated as lumped masses on their supports, being non-structural and presumably irrelevant to the load-path. The question of flexible (option 1) or rigid (option 2) connections required two separate models for analysis. At this model generation stage, the sensitivity to the inclusion of these parts remained uncertain.
4. First modal analysis
In structural dynamics, identifying the vibration modes of a system is essential for understanding its dynamic behaviour. Modal analysis techniques are employed to determine a model's eigenvalues and mode shapes, which represent inherent properties of a linear time-invariant (LTI) system with multiple degrees of freedom (MDOF).
The equations of motion for an undamped MDOF system, when considering harmonic motion, lead to an eigenvalue problem. A nontrivial solution to this problem exists when the determinant of the following matrix expression is zero
(1)
For the initial FE models, the resulting set of eigenvalues and corresponding eigenvectors {?}? are shown in Figure 3.
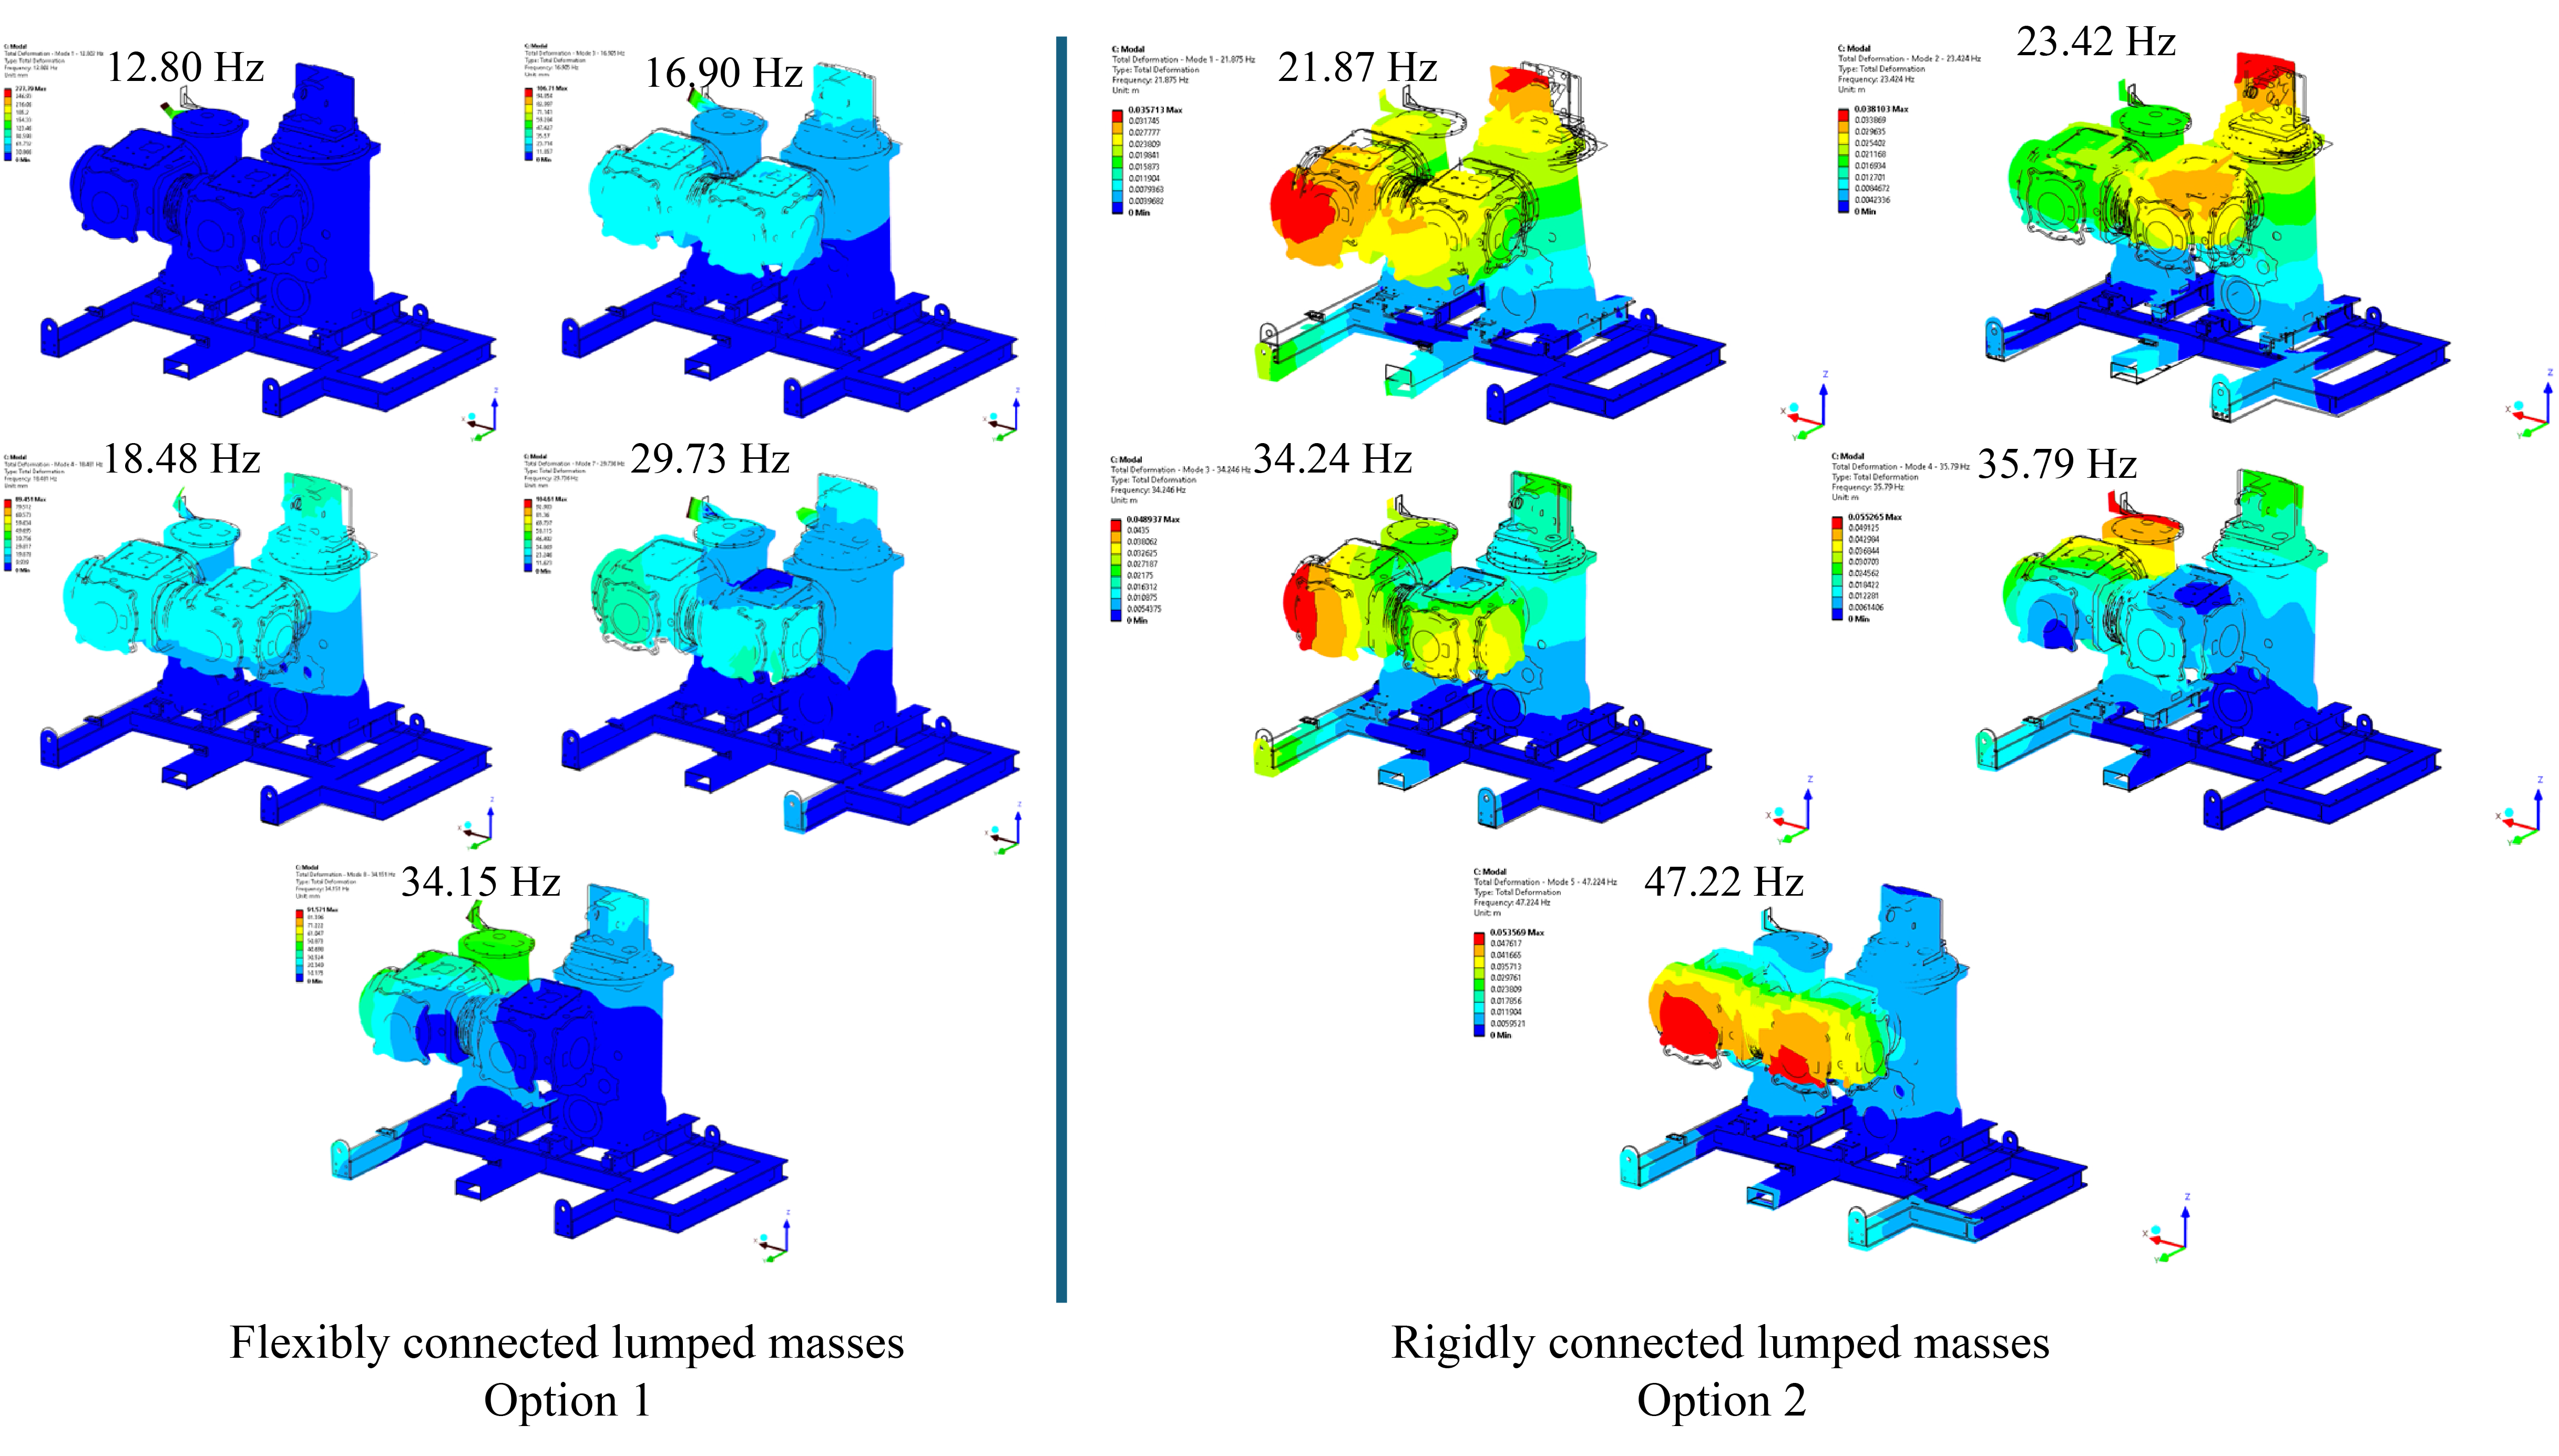
Figure 3 – Overview of the modal results of the GIS. On the left are results of option 1, on the right those of option 2
The modal analysis indicates that model 1 (option 1) has a first natural frequency at 12.8 Hz, with local vibration of the control cubicle on the passive module. Significant natural frequencies begin at 16.9 Hz with an X-axis bending mode, and at 18.48 Hz around the Y-axis. For option 2, the local mode is absent, and significant modes appear at 21.87 Hz and 23.42 Hz around the Y- and X-axes, respectively. The substantial differences in structural dynamics between the models highlighted the need for empirical testing to validate the theoretical predictions at this stage.
| Mode type | Frequency [Hz] | Modal mass to total mass ratio Opt.1 | Frequency [Hz] | Modal mass to total mass ratio Opt.2 |
|---|---|---|---|---|
| Local 12.80 | 12.80 | - | - | - |
| Bending around X | 16.90 | 0.37 | 21.87 | 0.28 |
| Bending around Y | 18.48 | 0.44 | 23.42 | 0.33 |
5. Testing set-up, natural frequency results and refined FE model
A testing campaign was conducted to obtain the dynamic characteristics of the equipment and subject it to specific loading scenarios, such as stationary vibration and transport-related shocks. Concurrently, the FE concept was refined to include the previously considered "non-structural" enclosures and evaluate their contribution to the overall structural system.
Instruments like accelerometers and rosette strain gauges were used to analyse motion characteristics and associated stresses. The placement of these instruments is depicted in the Figure 4. Accelerometers A2 and A3 were particularly important as they showed how motion is transferred through the load-path from the overhanging modules to the base or fixation points.
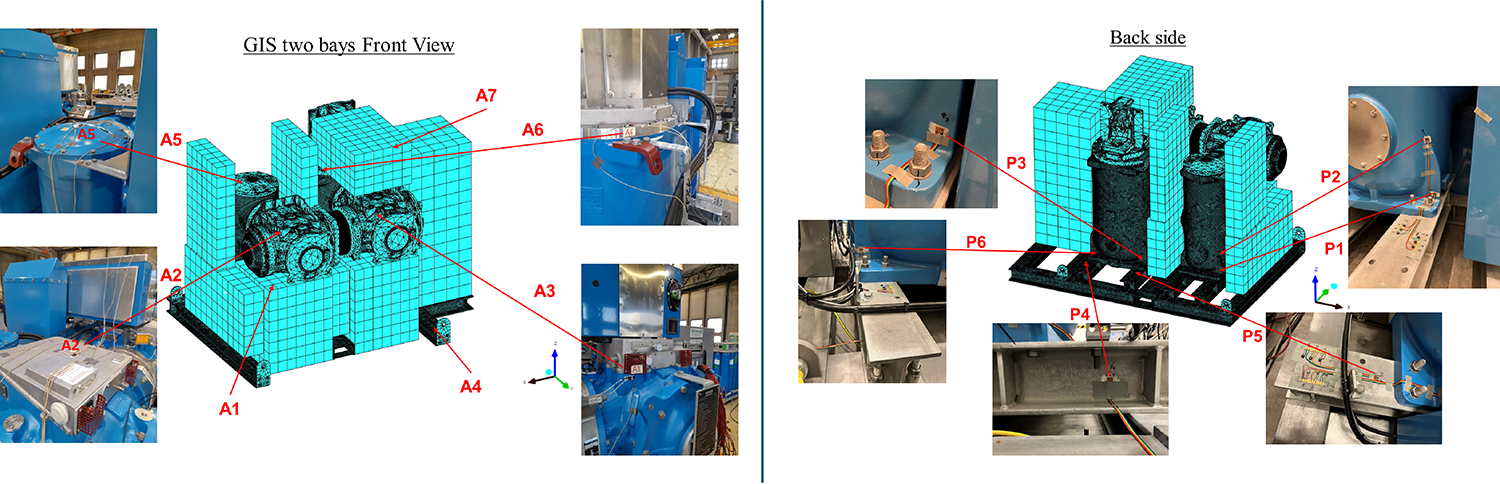
Figure 4 – Overview of the refined GIS FE model and details of the instrumentation during the testing campaign
Resonant frequency search tests, performed via a sinusoidal sweep scan [5], allowed to calculate transfer functions at each measurement point based on the frequency response functions. Damping ratios for the resonant frequencies were determined using the half-power bandwidth method. Table 2 summarizes the parameters pertaining to the natural frequencies first observed along the X-axis.
| Sensor | Frequency [Hz] | Damping [%] | Amplification [g/g] |
|---|---|---|---|
| A2 | 18.7 | 3.3 | 13.1 |
| A5 | 18.7 | 3.3 | 9.5 |
| A6 | 18.7 | 3.3 | 10.0 |
| A7 | 81.0 | 3.7 | 8.6 |
Considering the test results, a consistent damping ratio of 3 % was applied to all modes in the FE model. While other damping considerations exist, such as Rayleigh damping [6] with coefficients proportional to the stiffness and mass matrices or mode-independent damping, the chosen approach was deemed suitable and practical for this study.
The FE model results, assuming the specified damping ratio, were then compared with the actual test data for accelerometers A2 and A3 in both the X- and Y- directions, as shown in the corresponding Figure 5.
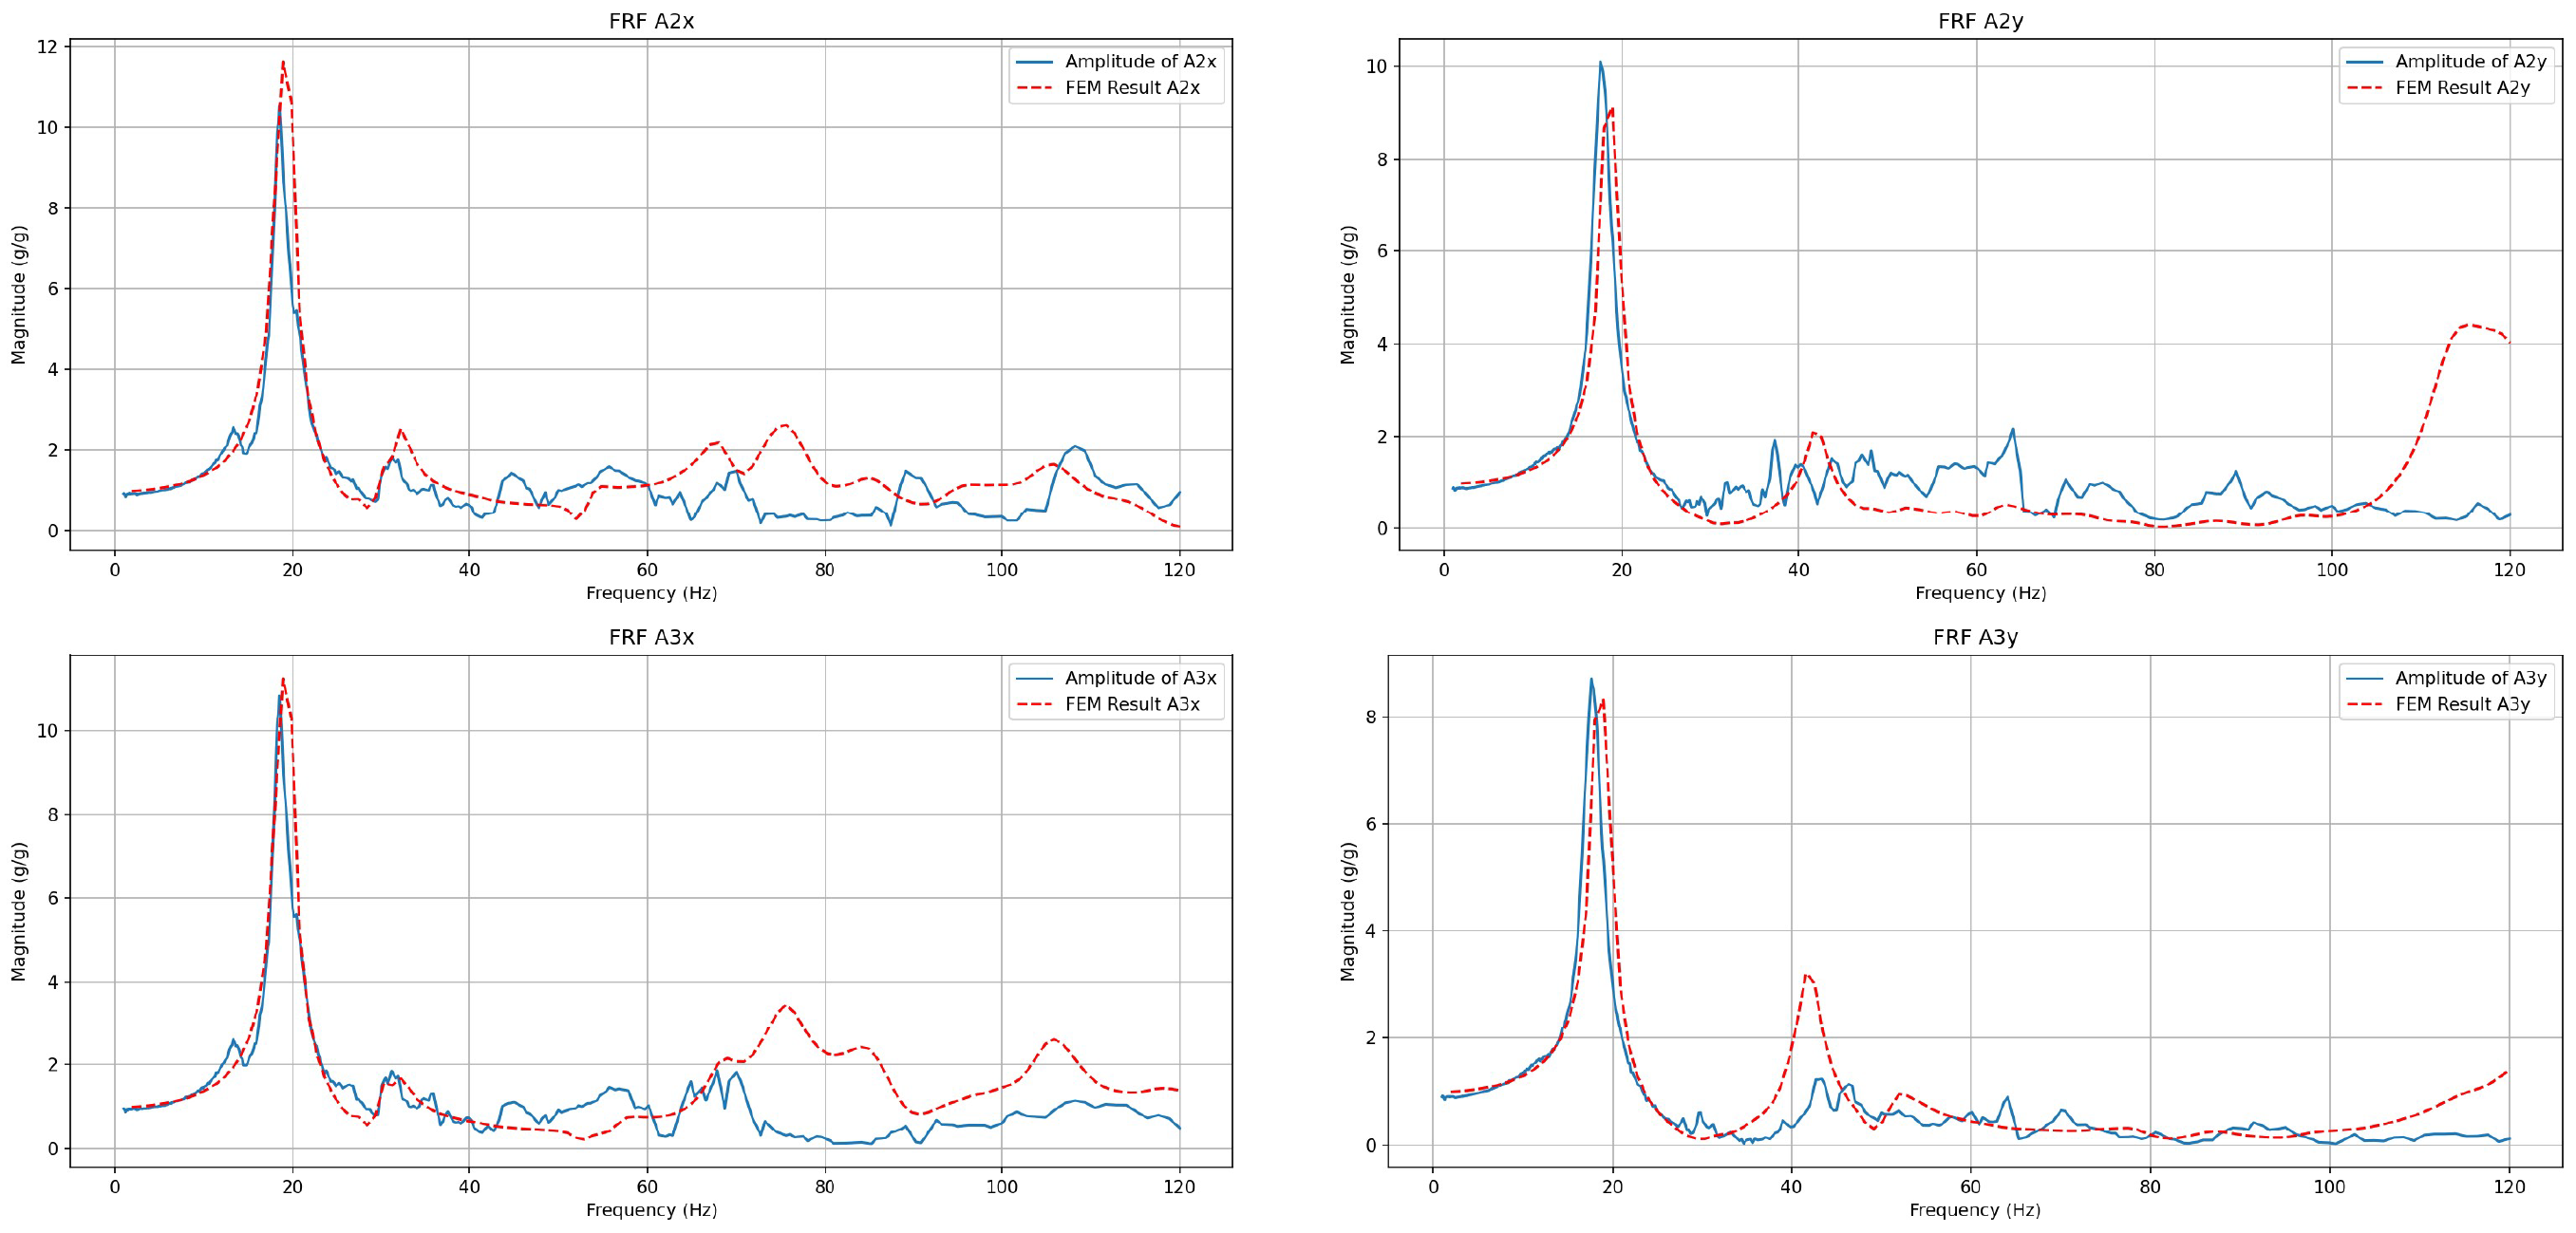
Figure 5 – Comparison between the results of the FE model and test in terms of transfer functions obtained in A2x (upper left), A2y (upper right), A3x (lower left) and A3y (lower right)

6. Stationary vibration test and FE simulation
Transport conditions and prolonged exposure to vibration environments in industry are typically characterized by power spectral density (PSD) profiles. The excitation input requirement specified by the PSD assumes that the loading process is stationary. For the purposes of this study, the equipment was subjected to the requirements of the International Safe Transit Association (ISTA) 3E Procedure [7].
The response ?[?(?)] of the equipment is described by a random process ?(?) whose expected value is interpreted as the average value ?̅ when an infinite number of observations exist. In terms of modelling, the system is treated as a linear time-invariant (LTI) system, represented by ?(??). Its response ???(?) to an input random process ???(?) is calculated in the frequency domain using
(2)
where the LTI is interpreted as a filter and the expected value of the mean square response is calculated through integration over the complete frequency range
(3)
The results of the calculation process, expressed in terms of acceleration, are compared with test values as shown in Figure 6, where the stationarity of the response is evidenced.
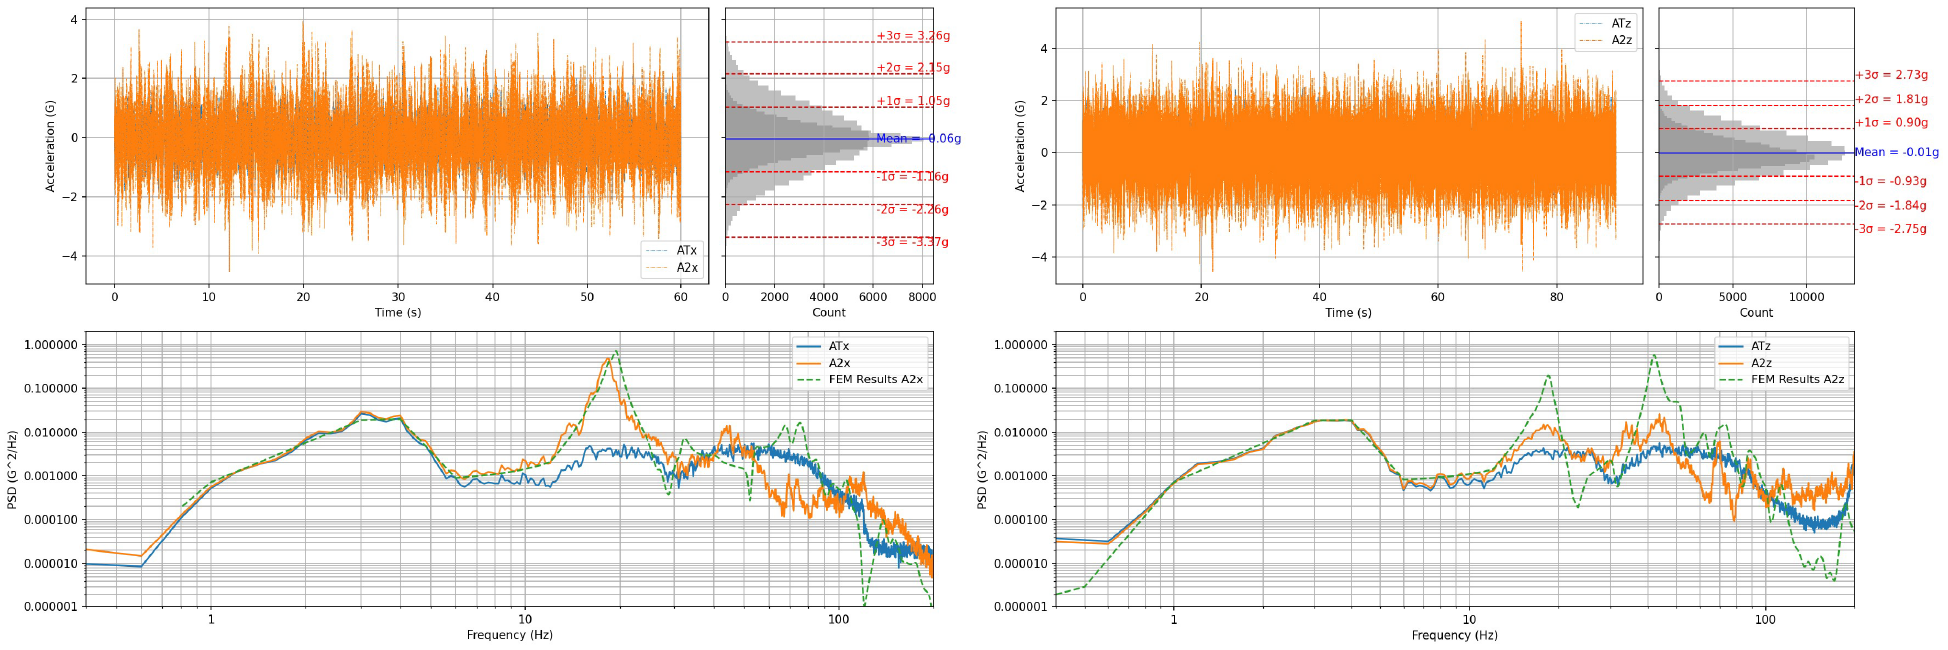
Figure 6 – Comparison between the results of the FE model and test in terms of PSD responses. Upper left: Stationary response in time of A2x and ATx. Upper right: Stationary response in time of A2z and Atz. Lower left: PSD outputs (FE and test) of A2X and PSD input of ATx. Lower right: PSD outputs (FE and test) of A2z and PSD input of Atz
It is apparent that the responses at the presumed natural frequencies are tracked with notable precision, particularly with some overshoot due to the assumption that higher frequency modes are damped with a 3 % ratio. It is possible that more damping of these higher modes may occur. Similarly, the computed stress results, employing the equivalent von Mises stress as a numerical method to aggregate the multiaxial response of the strain gauges during the stationary process, are presented in Figure 7.
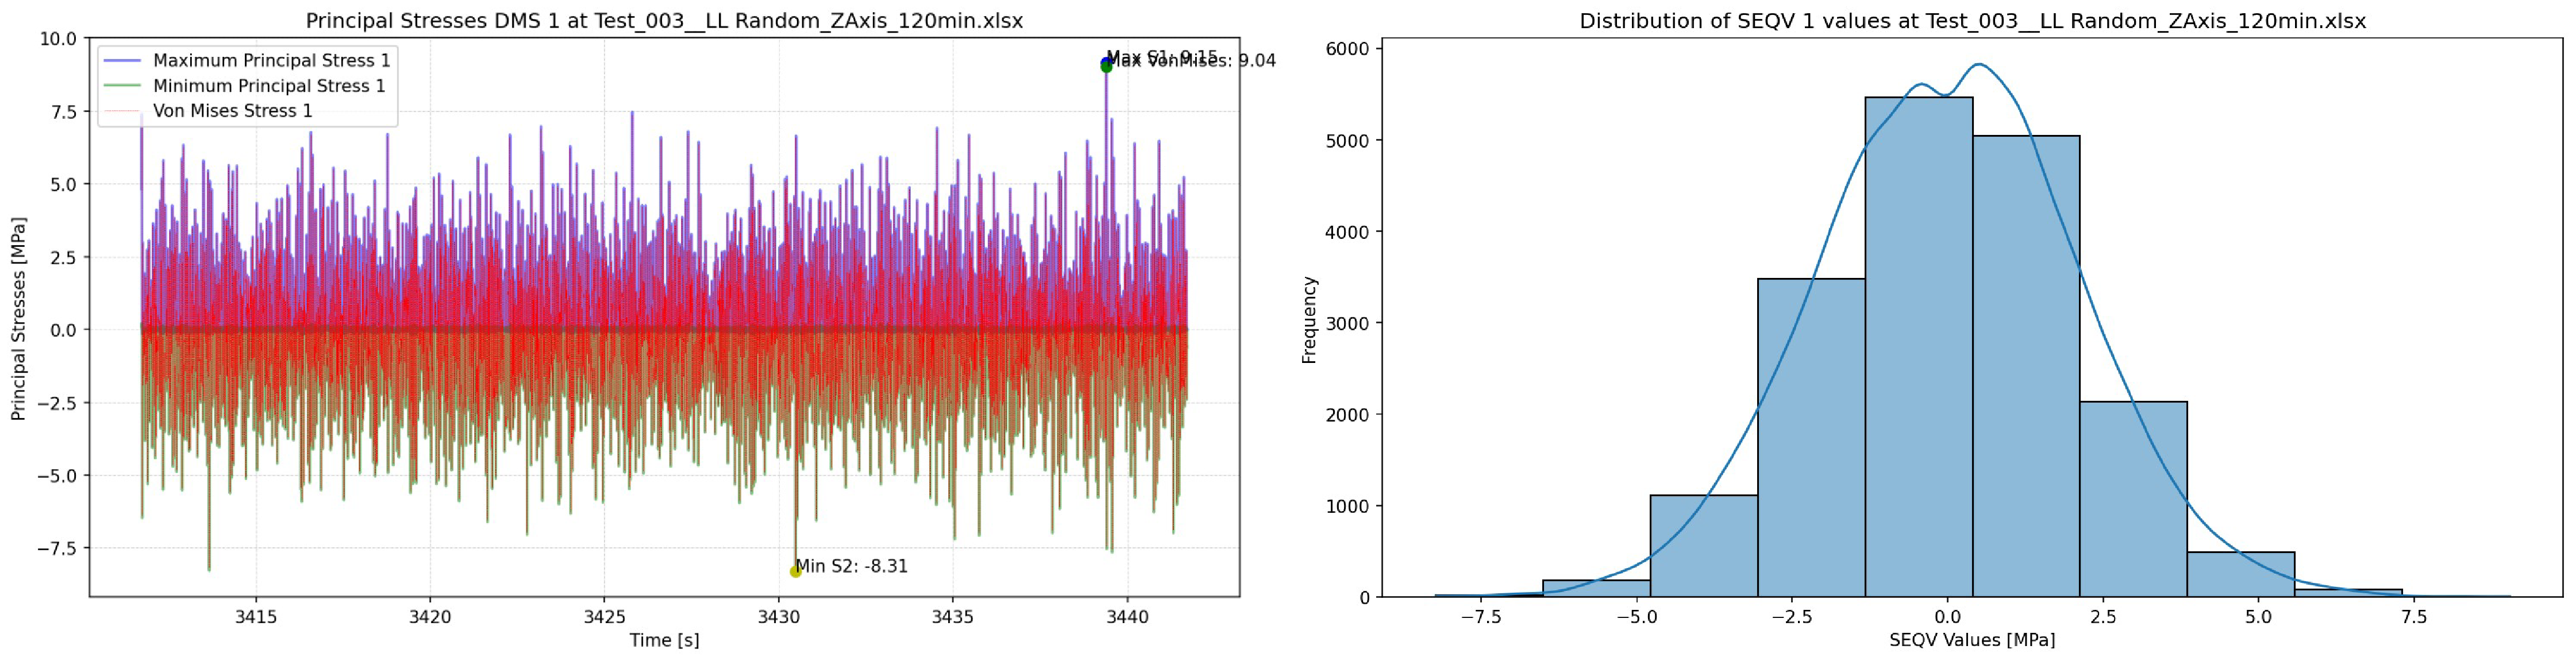
Figure 7 – Computation of stresses (in time) of instrument P1 and its corresponding histogram
The results from the random vibration simulation using the FE, in terms of acceleration and stresses compared to those obtained from the testing campaign, are illustrated in Figure 8. A ± 20 % accuracy band is presented to evaluate the quality of the model against the empirical test results.
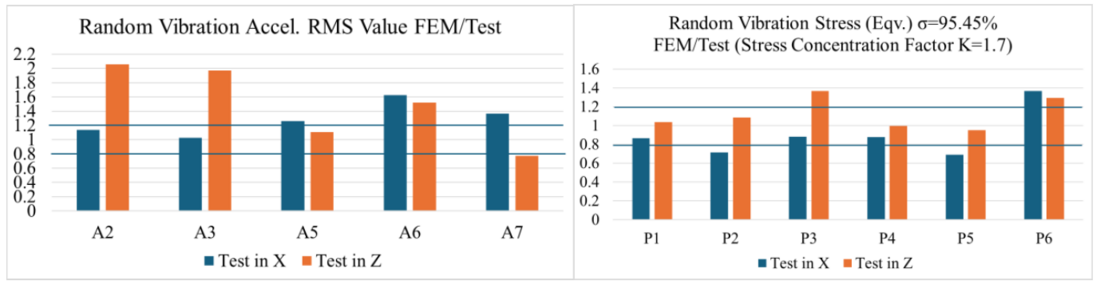
Figure 8 – Comparison of results in the random vibration environment: FE model normalized to those obtained through tests
It is evident that there are overestimations by a factor of 2.0 for A2 and A3, particularly with respect to the root mean square (RMS) response in the Z-axis. This discrepancy may be due to the simplified assumption of a consistent damping ratio, whereas it is likely that higher modes would exhibit more significant damping in practice. It should be emphasized that replicating the RMS responses of a tested system with precision is extremely challenging. This is because it would require the multi-degree-of-freedom (MDOF) system to be accurately modelled, considering all structural and non-structural components and their respective damping ratios, especially when dealing with random processes.
In terms of stress analysis, the model's results at the 95.45% quantile in the stationary process align reasonably well within the accuracy band. However, the least conservative results are underestimated by about 70% compared to those obtained through testing.
7. Shock tests
High-speed transient loads are sometimes characterized by shock events [8]. In our study, a loading profile consisting of half-sine shocks with a pulse duration of 30 ms and acceleration levels of 1.5 g for both X- and Y- directions, and 2.0 g for the Z- direction, was applied to the equipment. Like the stationary vibration case, the comparison scheme is presented in Figure 9.
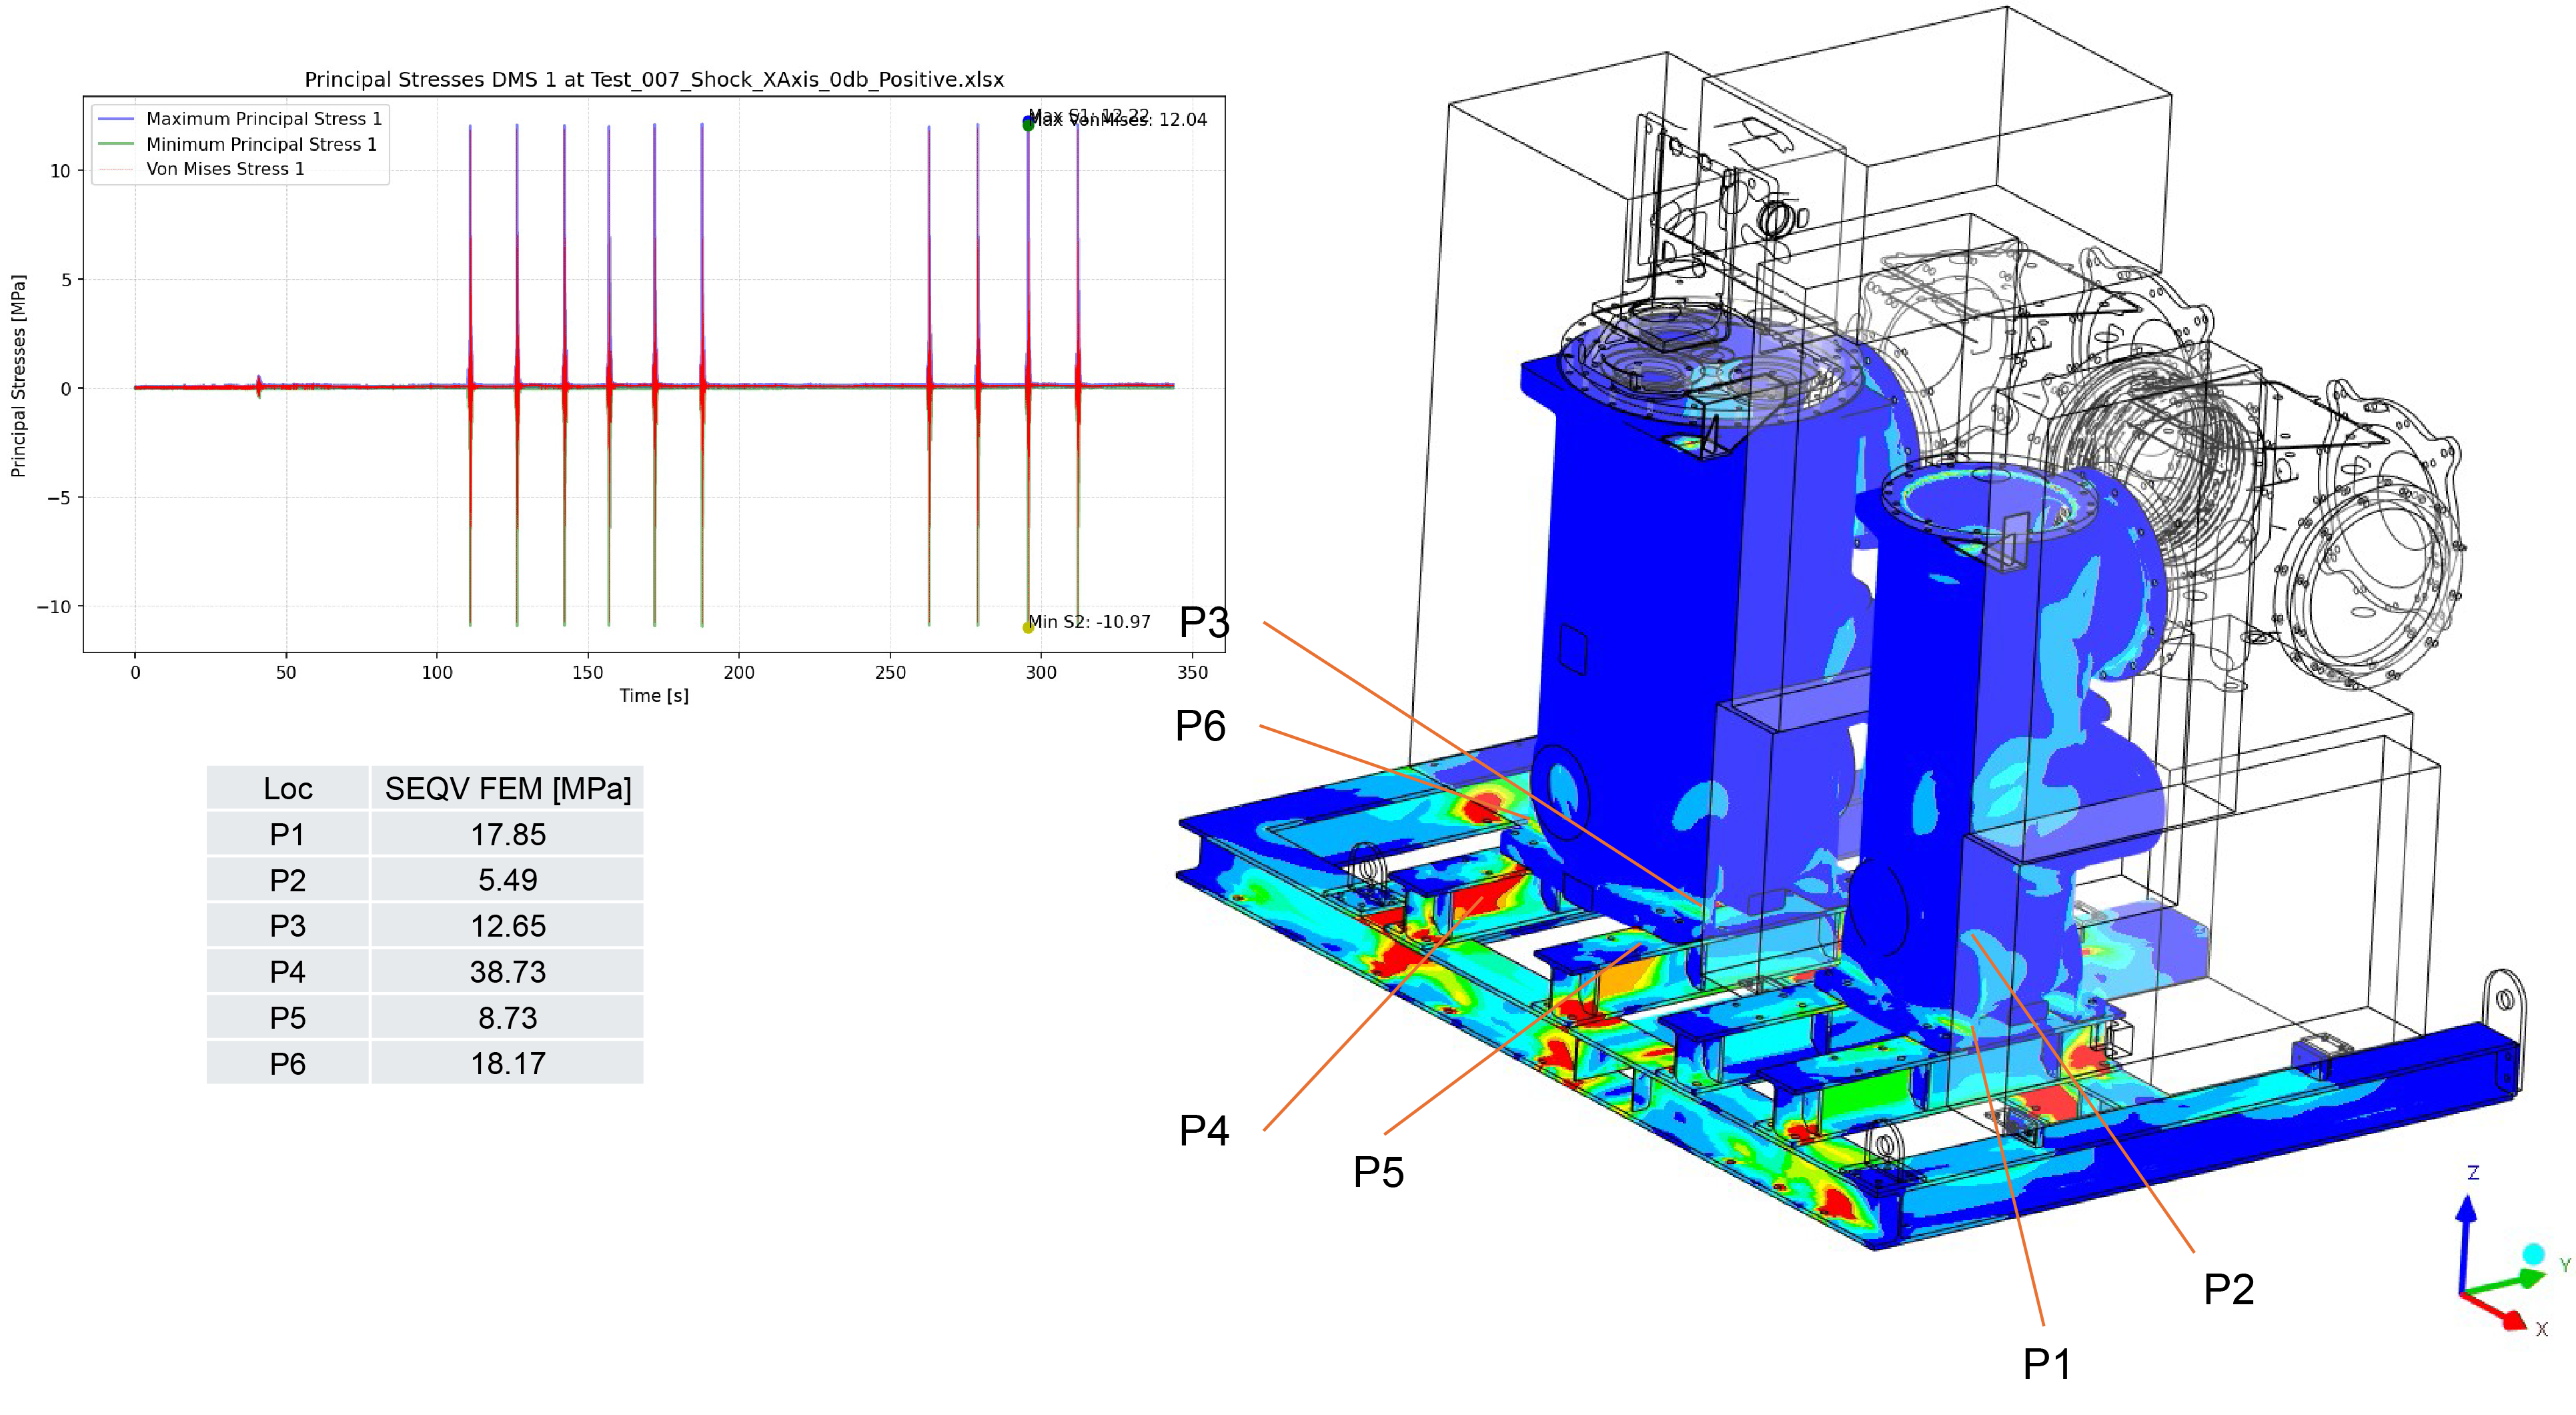
Figure 9 – Results scheme of the shock environment produced by the FE model and visualization of stress produced in P1 during shocks over time (upper left)
The overview of acceleration results, which includes the use of ± 20 % accuracy band is presented to assess the quality of the model against the testing results on the shock loading environment.
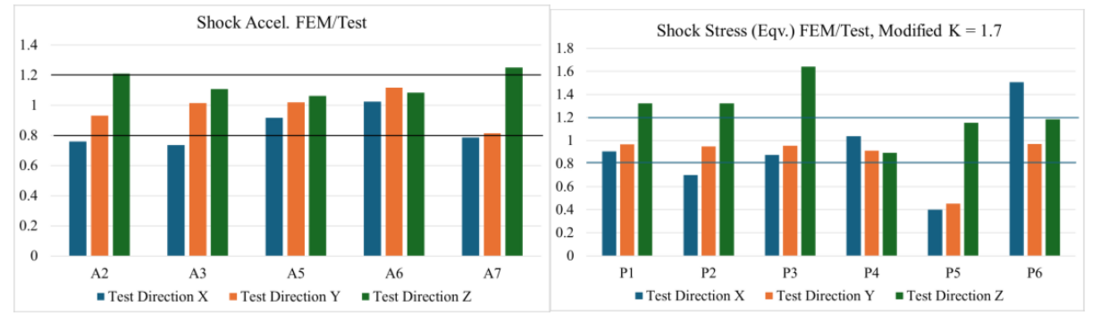
Figure 10 – Comparison of results in the shock loading environment: FE model normalized to those obtained through tests
The results from the FE model, in terms of accelerations, align more closely with the accuracy band when compared to those from the random vibration environment; this improved correlation can be attributed to the deterministic nature of the shock loading conditions. In the case of stresses, however, significant discrepancies are observed, particularly for P5 when tested in the X- and Y- directions, as opposed to the tests in the Z- direction. The smallest underestimation is noted to be around 40%. This suggests that the model may require refinement, or that the spurious transverse and rotational motions encountered during the testing campaign have a significant impact on these responses.
8. Seismic and offshore long-term loading conditions (simulation only)
Considering the results from the testing campaign alongside those produced by the FE model, and in line with the decision-making process outlined in Section 2, it has been determined that the model is sufficiently practical and accurate for use in the simulation of untested environments, albeit with some reservations. Of particular significance is the application of the model to the target earthquakes, aiming for a high-performance level as per IEEE Std. 693-2018 [9], or to simulate offshore long-term wave loading conditions, which are defined using metocean data and hydrodynamic models of the floating structures. Illustrative examples of these loading scenarios are presented in Figure 11.
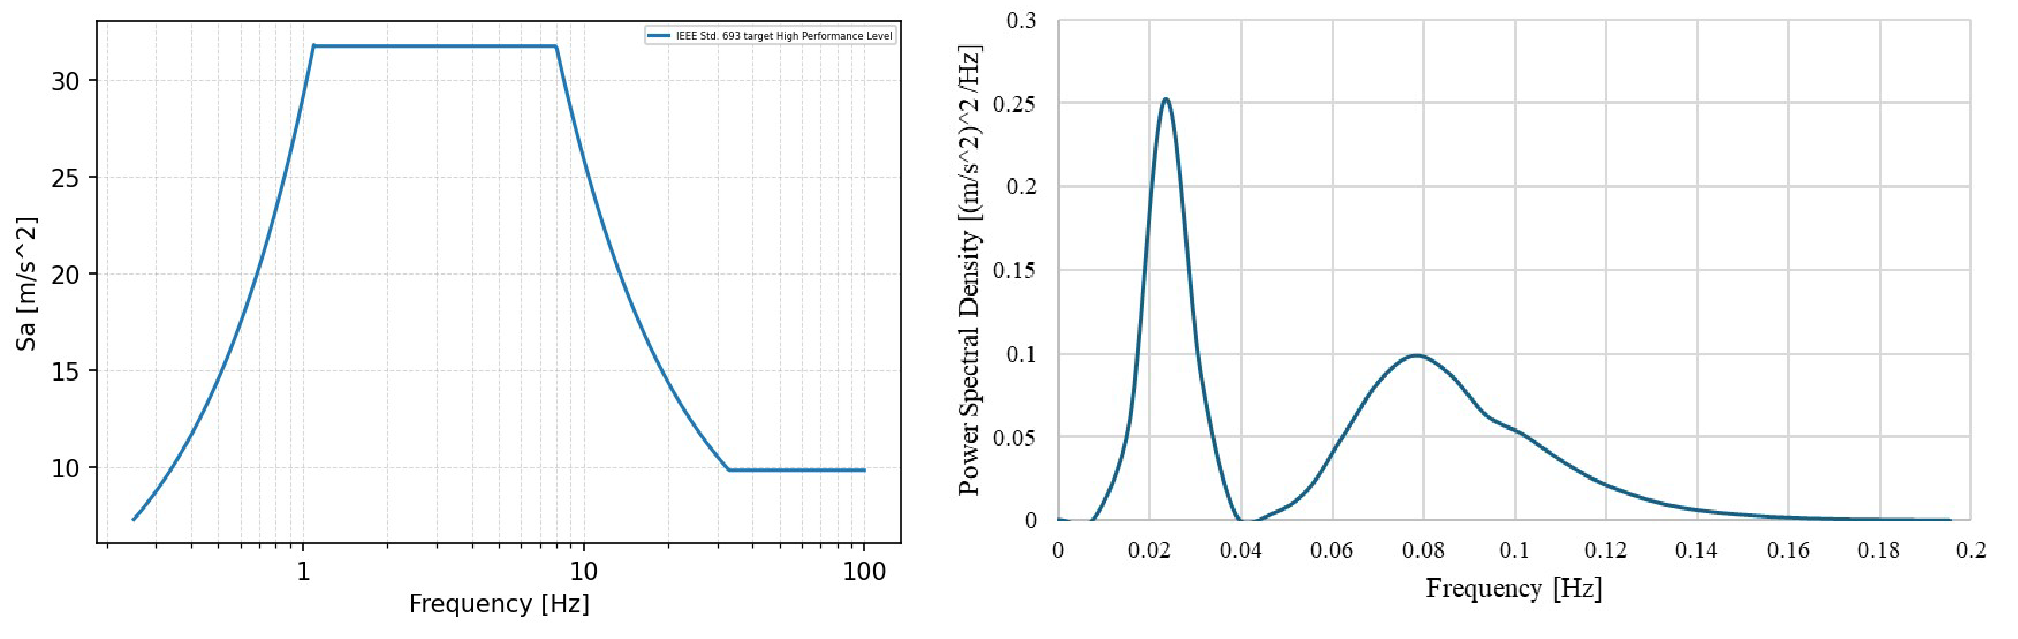
Figure 11 – Simulated loading environments using the validated FE model. Left: High Performance Level, target Response Spectrum for 2 % damping of the IEEE Std. 693-2018 [9]. Right: Exemplary Long-term acceleration PSD Spectrum based on metocean data and hydrodynamic studies of a floating unit
Conducting full-scale, long-term offshore environment testing on equipment over a duration such as 30 years is impractical, uneconomical, and likely infeasible given the constraints of current testing facilities. Consequently, the developed model was subjected to the loads detailed in this section to evaluate long-term fatigue in metallic components.
The damage accumulation ? of a stationary Gaussian wide-band process can be estimated by means of results of the spectral density function of each DOF: the equivalent alternating stress ???? and the equivalent frequency of the process ?0. Moreover, the following is needed: the exposure duration ?, the negative inverse slope of the S-N curve of the material ?, the S-N curve constant ??? and the Euler’s gamma function evaluated at 1 + ?/2.
(4)
The results of both studies—the seismic and the offshore fatigue—are presented in Table 3 where the safety margin for the seismic case is calculated relative to the brittle failure of structural components (aluminium casting and structural steel), and damage accumulation over 30 years for the offshore case.
| Location | Stress [MPa] - Seismic | Stress [MPa] - Offshore | Safety margin | Damage accumulation |
|---|---|---|---|---|
| P1 | 21.01 | 3.30 | 10.95 | 0.0790 |
| P2 | 6.95 | 1.75 | 33.09 | 0.0025 |
| P3 | 17.83 | 2.57 | 12.90 | 0.0200 |
| P4 | 34.28 | 3.16 | 11.67 | 0.0015 |
| P5 | 8.05 | 1.87 | 49.71 | 0.0002 |
| P6 | 19.53 | 2.33 | 11.78 | 0.0100 |
9. Conclusions
In this paper, we have presented insights into the preparation of a robust Gas-Insulated Switchgear Finite Element (FE) model designed to realistically simulate the response of structures under various loading conditions, with a particular focus on structural dynamics. We have showed that components traditionally considered 'non-structural' and not central to the load path can significantly influence the overall response of the structural system.
The creation of a digital asset capable of predicting a broad spectrum of conditions and configurations for a family of products is essential to ensure the robustness and durability of power network components. This is especially true for long-term environmental conditions that are impractical to test empirically; thus, simulation remains the sole method for verifying fatigue of the components. Additionally, not all potential weak points in a structural system can be monitored during physical testing, making a well-prepared FE model invaluable for identifying these vulnerabilities.
Assessing predicted stresses and dynamic responses of equipment modelled using the Finite Element Method requires careful consideration of the assumptions made, including idealization and discretization errors. Such scrutiny is key when the model is used for future verifications. In our study, the model's predictions fell within a ± 20 % accuracy band, with the best-case scenario showing overestimations above this threshold. In the worst-case scenario, stress underestimations in shock responses reached 40 % compared to the tested values. At the time of writing this paper, the exact causes of these discrepancies were unclear but may be attributed to unintended transversal or rotational motions induced by the testing apparatus.
References
- Zienkiewicz, O.C., The Finite Element Method in Engineering Science. London (England): McGraw-Hill; 1971
- Zienkiewicz, O.C., Taylor, R.L. The Finite Element Method: Its Basis and Fundamentals. Oxford (England): Elsevier Science; 2013
- Craig, R.R., Kurdila, A.J., Fundamentals of Structural Dynamics. Wiley; 2006
- Chopra, A.K., Dynamics of Structures: Theory and Applications to Earthquake Engineering. New Jersey (USA): Prentice Hall; 1995
- International Electrotechnical Commission. IEC 60068-2-6. Environmental testing, Part 2-6: Tests – Test Fc: Vibration (sinusoidal). Geneva (Switzerland); 2007
- Rayleigh, L., Theory of sound. New York (USA): Dover Publications; 1945
- International Safe Transit Association. ISTA 3E. Procedure: Similar Packaged-Products in Unitized Loads for Truckload Shipment; 2017
- International Electrotechnical Commission. IEC 60068-2-27. Environmental testing – Part 2-27: Tests – Test Ea and guidance: Shock. Geneva (Switzerland); 2008
- IEEE Standards Association. IEEE Std. 693: Recommended Practice for Seismic Design of Substations. New York (USA); 2018
- Miles, J.W., On Structural Fatigue under Random Loading. J. Aeronautic Society, 21:753-762, 1965
- Det Norske Veritas – Germanischer Lloyd: Recommended Practice: DNVGL-RP-C203: Fatigue Design of Offshore Steel Structures. DNV, Hoevik (Norway); 2014
- Ship Structure Committee: SSC-373. Probability Based Ship Design; Loads and Load Combinations. Ship Structure Committee. Washington (USA); 1994
- Wirsching, P.H., Light, M.C., Fatigue Under Wide Band Random Stresses, Journal of the Structural Division, ASCE, Vol 106, p. 1593-1607; 1980