Techno-economic assessment of connection concepts – Methodology and application for Germany’s far out North Sea offshore wind areas
Authors
Tuncay Türkucar, Gerald Blumberg, Dr. Philipp Heuser, Alexander Schrief, Andreas Gelfort, Christopher Kneip, Dr. Henrik Schwaeppe
E-Bridge Consulting

Summary
This paper evaluates four connection concepts for integrating 14 GW of offshore wind farms in the far-out German North Sea zones 4 and 5: a purely electrical connection (All E), a full offshore hydrogen option (All H₂), and two mixed connection concepts (MC1 and MC2) combining HVDC cables and offshore electrolysis in different proportions.
The concepts are assessed with three energy scenarios (2035 - 2045) using techno-economic modelling. Key performance indicators include investment costs, system revenues, asset utilisation, and net present value.
Results show that a hydrogen-dominant mixed concept (MC2) consistently delivers the best outcomes with regard to the techno-economic integration of the offshore wind energy potential. The focus on hydrogen reduces infrastructure costs, while providing flexibility for the energy system. The concept serves both electricity and hydrogen markets depending on the value of the energy form over time. Additionally, the electrical infrastructure can also be used to produce hydrogen with surplus onshore energy when offshore wind is weak.
Mixed connections can play a crucial role in aligning offshore wind and hydrogen expansion for a cost-effective and future-ready energy system.
Keywords
Energy Transition, German North Sea, Green Hydrogen, Offshore Wind, Power-to-X, Spatial Planning, System Integration, Techno-economic Analysis, Toolchain1. Introduction and Objective
The decarbonisation of the energy system in Germany and across Europe requires a substantial expansion of renewable energy generation and the development of supporting infrastructure. Offshore wind farms (OWFs) play a central role in this transition due to their large-scale potential and stable generation profiles. In particular, the far-out offshore wind zones 4 and 5 (see figure 1) in Germany’s Exclusive Economic Zone (EEZ) of the North Sea - commonly referred to as the “duckbill” - offer great expansion potential. However, their remote location presents considerable challenges for cost-efficient and technically feasible connection to the mainland.
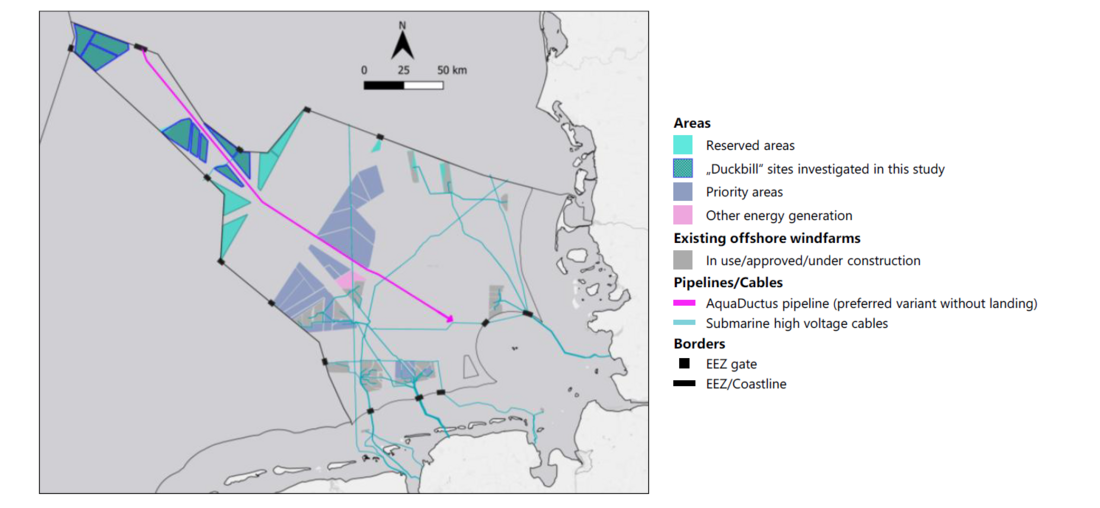
Figure 1 - Zones 4 and 5 of the German EEZ under investigation
Simultaneously, green hydrogen production is gaining strategic importance. Hydrogen provides a flexible and storable energy carrier, enabling sector coupling and supporting the decarbonisation of hard-to-electrify sectors such as industry and long-haul transport. Offshore electrolysis, powered by wind energy, has the potential to produce green hydrogen at sea and feed it into dedicated hydrogen infrastructure like the planned AquaDuctus pipeline. This could ease the burden on congested onshore electricity grids and improve the overall integration of offshore resources.
To date, connection concepts for offshore wind farms have typically followed two paths: purely electrical grid connection via high-voltage direct current (HVDC) cables or exclusive hydrogen production with offshore electrolysis and pipeline transport. Both approaches come with technical and economic trade-offs. A third option - the mixed connection concept (MC) - integrates both electricity and hydrogen transport infrastructure, allowing for greater flexibility and system optimisation.
The objective of this paper is to assess the techno-economic implications of four connection configurations for 14 GW of OWF capacity in the far-out German EEZ within the scope of the AquaVentus project.
2. Methodology and Evaluation Logic
The methodological framework is designed to determine the connection concept with the greatest socio-economic benefit. The quantitative techno-economic modelling assesses energy output, revenue potential, capital and operating expenditure (CAPEX and OPEX), equipment utilisation, and financial performance indicators such as net present value (NPV) and internal rate of return.
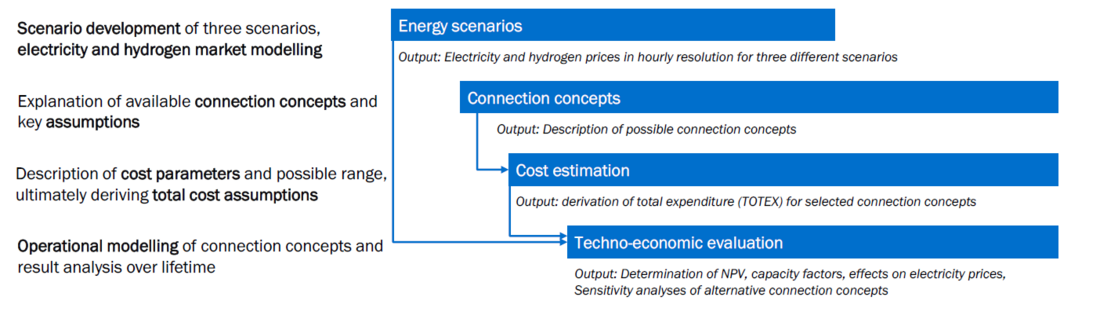
Figure 2 - Methodology of the assessment
Key components of the methodology include:
- Detailed bottom-up cost estimation per system component
- Full-scale simulation of wind energy generation and market prices
- Operational modelling of OWF configurations
- Sensitivity analyses (e.g. bidirectional cable use, overplanting, onshore electrolysis)
3. Energy Scenario Modelling
To reflect plausible future developments in the energy system, three distinct scenarios were developed for the reference years 2035, 2040, and 2045, assuming respective system capacities (e.g. electrolyser capacity, battery storage, RES). These scenarios serve as input to electricity market modelling and hydrogen price estimation.
- Climate Neutrality 2040 (CN): High electrification and RES expansion, full decarbonisation by 2040.
- Molecule-based Energy Transition (MET): Strong hydrogen uptake, climate neutrality by 2045.
- Delayed Energy Transition (DET): Slower decarbonisation due to social and economic constraints; climate neutrality delayed to 2055.
3.1. Description of the energy scenarios
The scenario “Climate Neutrality 2040” (CN) focusses on high efficiency gains and electrification in Germany and Europe. Germany achieves climate neutrality in 2040 which is in line with Germany’s federal targets. This is achieved by a high level of acceptance in the population fostering a rapid expansion of RES and power grids. Coal phase-out plans are reached by 2030. Through costly investment programs, additional efficiency improvements (high housing renovation rate, shifts in transportation), ambitious transformations in the industries (electrification as far as possible and high efficiency gains) and a strong focus on electrification in buildings (heat pumps), and transportation (electric cars and trucks) is assumed in this scenario. We differentiate the European countries in their transition speed, i.e. some reach climate neutrality 2045 (cf. Ten-Year Network Development Plan (TYNDP)). Domestic H2 electrolysis production is encouraged and growing through the availability of cost-efficient RES electricity.
The scenario “Molecule-based energy transition” (MET) achieves the decarbonization until 2045 in line with the German policy targets by a strong(er) use of green gases (in comparison to CN). In line with the forecast of this transition scenario, a decisive share of current CH4 demand within the industry and heating sectors gets substituted. Yet, the increased use of H2, especially in industry beyond material utilisation but also in some regions in the heating sector (e.g., heating networks) and in some parts of the heavy-duty transport sector leads to an overall higher level of hydrogen utilisation. This development is also driven since limitations in acceptance of RES extension and a stronger push from society in the direction of (green) gas applications for diversification, whole system efficiency, and cost reasons. The scenario has consequently a higher level of energy (hydrogen) import in the long run but therefore can manage to decrease the final onshore RES extension level (while maintaining it at a high level). A coal phase-out is reached latest by 2038.
The scenario “Delayed energy transition” (DET) assumes an overall slower transformation speed due to acceptance issues, costs, lack of materializing efficiency gains and bureaucracy. Acceptance issues with renewable energy expansion as well as skilled labour shortages, especially in building housing renovation and the required power grid expansion, are leading to delayed achievement of climate protection goals. Political objectives are being diluted and implemented only with delay. Prolonged retention of unabated fossil fuels – and especially of methane – in the energy system are assumed. With approximately ten years delay, the energy system in 2055 results in a comparable system design to the MET scenario.
3.2. Development of electricity and hydrogen prices
This chapter presents the results of the electricity market simulation. For each of the three scenarios, the simulation was carried out for the three target years 2035, 2040 and 2045, making a total of nine simulations. Developments after 2045 are extrapolated in line with the year 2045.
Figure 3 shows the average base electricity prices as well as the peak price (average of 3000 h with the highest price) and the off-peak price (average of 3000 h with the lowest price) for all three scenarios and target years. It must be noted that the minimum price in the fundamental market model is 0 EUR/MWh. Negative electricity prices are cut off at 0 EUR/MWh by the model as there is not sufficient fundamental and historical data available on negative electricity prices. Negative prices are currently caused by inflexible generation, wrongly skewed incentives through subsidies (e.g., EEG market premium) and inflexible demand. These effects will decrease in the future, meaning that prices below at 0 EUR/MWh or below are becoming more unlikely.
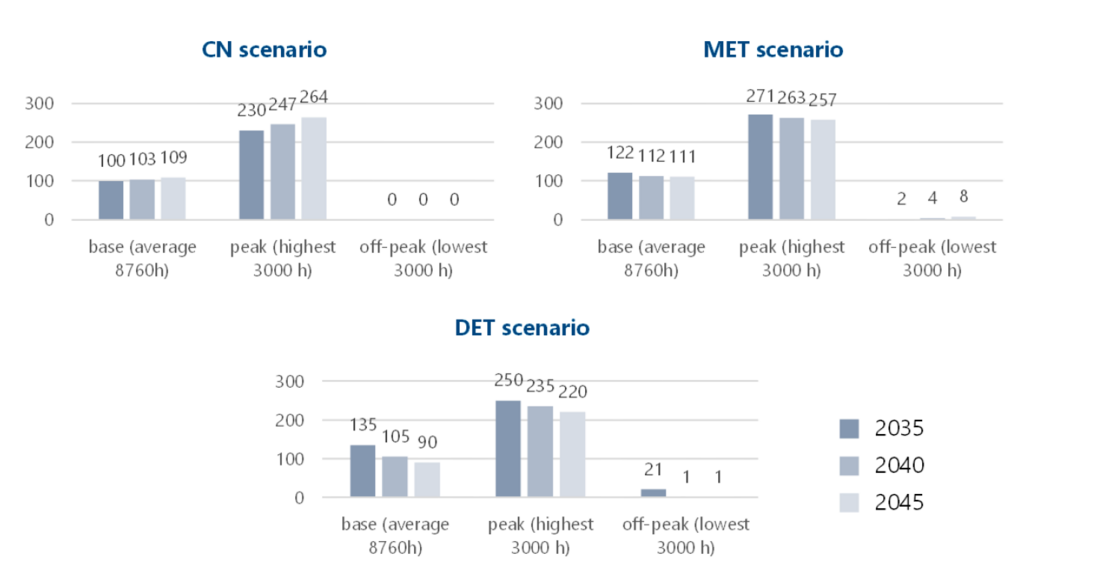
Figure 3 - Average annual base, peak and off-peak electricity prices per scenario and year
[EUR/MWh]
As import prices decrease over time and the amount of available (and low cost) domestic electricity increases, the prices for hydrogen decrease over time. Furthermore, the characteristics of the temporal resolved hydrogen price curve changes as well between 2035 and 2045. In 2035 the relatively higher import prices lead to more hours when domestic hydrogen is produced. This can be seen in the fluctuating course of the graph in Figure 5. The graphical progression smooths out over time due to the higher hydrogen demand that needs to be covered by imports with constant prices. In comparison to gas price curves in recent years, the overall seasonal flatness of the curves can be explained by the strongly decreasing influence of the space heating sector. Hydrogen is mostly demanded in the industry and mobility sector that both show a rather constant demand.
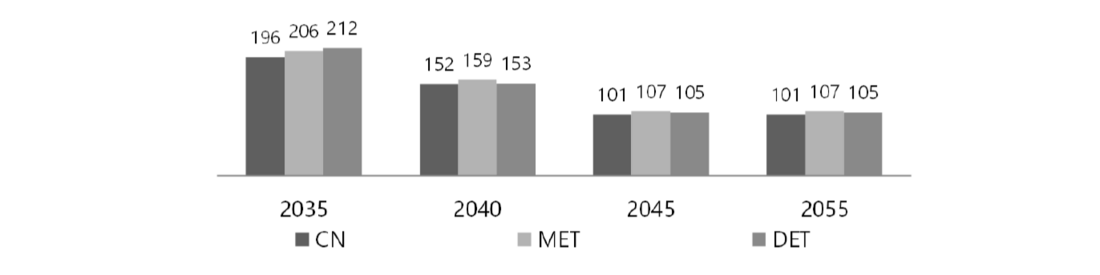
Figure 4 - Average hydrogen prices per year and scenario in Germany [EUR/MWh]
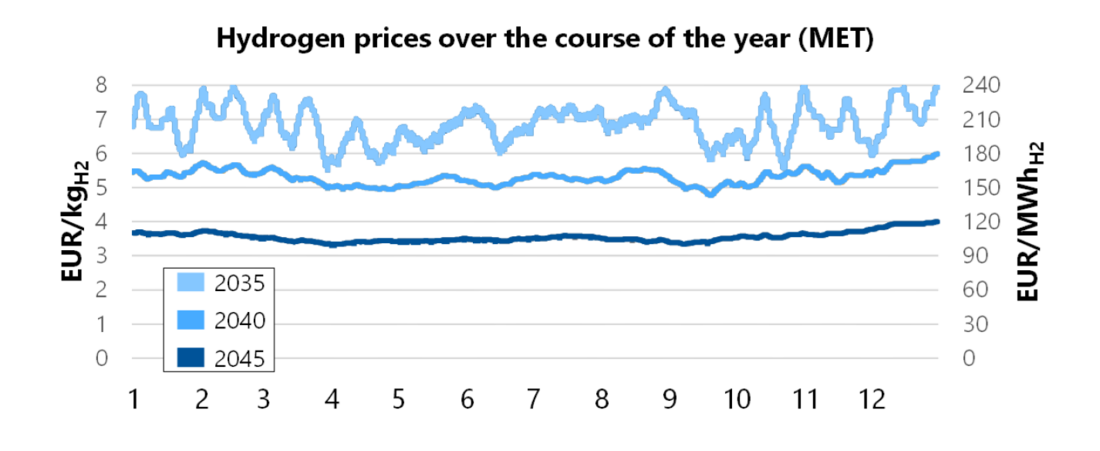
Figure 5 - German hydrogen wholesale prices in scenario MET (from 2035 to 2045)
3.3. Conclusion of the development of electricity and hydrogen prices
The development of the electricity markets is largely dependent on the expansion of renewables and future electricity demand (incl. electrolysers). The applied electricity market simulation takes such developments into account in various scenarios. The hydrogen markets are driven by demand, imports and local hydrogen production, the costs of which depend on electricity prices. The hydrogen prices are therefore derived in a second step.
Scenarios are used to project possible developments of the energy system into the future. Three scenarios have been developed: Climate Neutrality 2040 (CN), Molecule-based Energy Transition 2045 (MET) and Delayed Energy Transition 2055 (DET). While the climate targets are achieved in scenario CN and MET until 2045, with different executions and timings, DET delays the transition by 10 years. CN represents a strong electrification, MET and DET consider a stronger application of molecules. Overall, this setup covers a broad range of developments.
The electricity and hydrogen prices were derived from the modelling results. The average electricity price in 2045 ranges between 90 to 111 EUR/MWh. Significant differences per scenario for the evaluation of electrolysers and mixed connection concepts result from the number of hours with low and high electricity prices (and the hydrogen prices). The most low-price hours are to be expected in the CN scenario, the fewest in the MET scenario. The number and amount of very expensive hours varies per scenario and year. Hydrogen prices develop to roundabout 3.5 EUR/kgH2, just over 100 EUR/MWhH2. In 2045, hydrogen is cheapest in CN (101 EUR/MWhH2) and most expensive in MET (107 EUR/MWhH2).
4. Connection concepts and techno-economic evaluation
This chapter introduces the technical design of the connection concepts under evaluation and presents their techno-economic performance based on investment costs, system utilisation, and economic viability. The concepts differ in their infrastructure layout, capital requirements, and flexibility to respond to market conditions.
4.1. Overview of connection concepts
The existing options for connecting offshore wind farms (OWF) to onshore grid infrastructure are associated with different engineering challenges and different costs [1]. In the following, the technical concepts pursued are presented to subsequently derive the necessary costs in the following chapter. The following connection concepts are considered:
- The electrical connection of OWFs by means of DC grid connection system
- The combination of OWFs with offshore electrolysis and connection via hydrogen pipeline
- The combination of both concepts: electrical connection, offshore hydrogen production and transport via pipeline
A mixed connection is therefore a combination of the individual concept, whereby the specific implementation of the combination can differ depending on the intended application or framework conditions. It should be noted that wind turbines and electrolysers require auxiliary power supply even when no wind energy is available. Auxiliary supply can be achieved using battery storage or a connection to a neighbouring wind farm. An advantage of mixed connection concepts is that auxiliary supply is available for all system components.
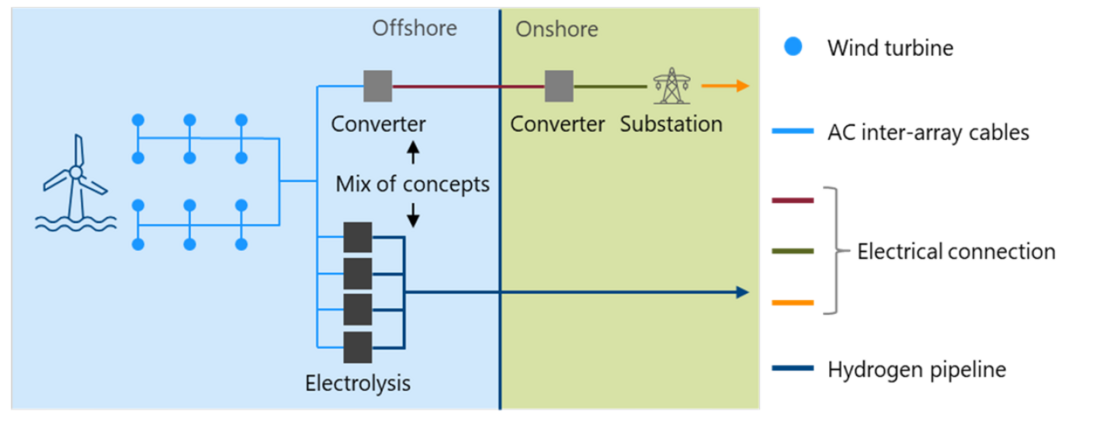
Figure 6 - Schematic illustration of a mixed connection concept
The following components are taken into account when analysing the connection concepts: Wind turbines, the converter required for connection to an HVDC export cable and the onshore converter, offshore electrolysers connected to the wind farms, and the (AquaDuctus) pipeline that transports the hydrogen onshore. Each HVDC cable has a transmission capacity of 2 GW. The pipeline has a transmission capacity of up to 20 GWH2. When utilising the pipeline, only up to half of the pipeline capacity is required for the hydrogen produced by AquaVentus.
In total, 4 different connection concepts are compared in detail (cf. Figure 6). An electric-only connection (All E) and a hydrogen-only concept (All H2) fully integrate the OWFs via cables or electrolysers. The mixed connection concepts vary in connection capacity via cable and electrolyser/pipeline. Concept MC1 focusses on electricity with 10 GW cable capacity and 4 GWel electrolyser capacity. Conversely, concept MC2 has 4 GW cable capacity and an electrolyser capacity of 10 GWel.
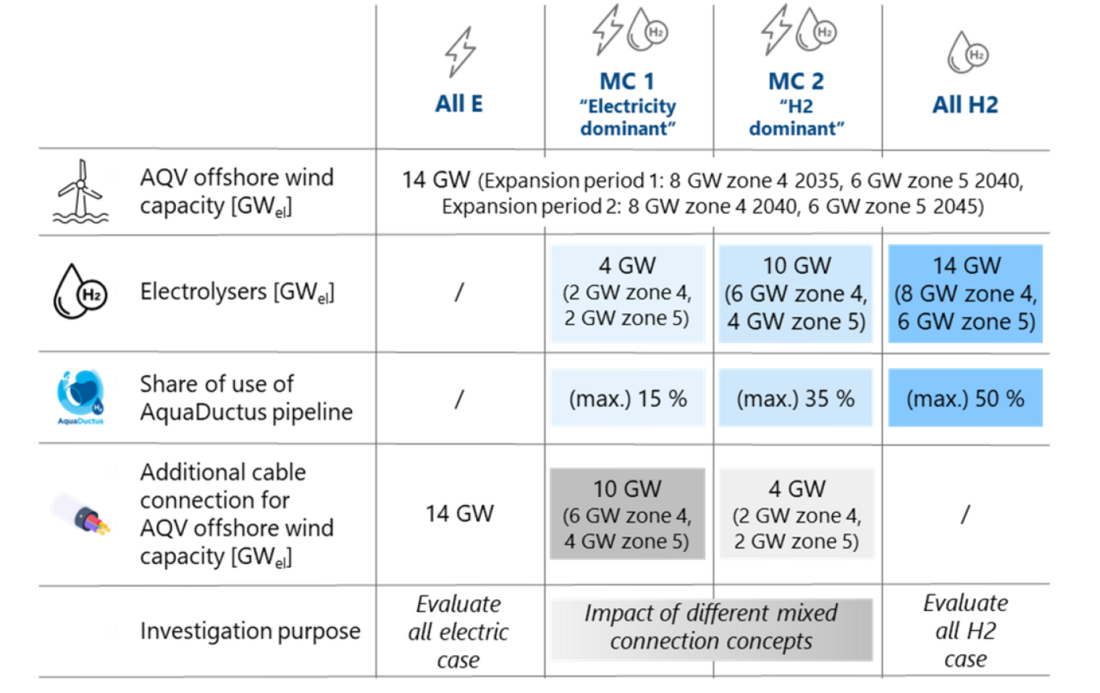
Figure 7 - Overview of the analysed hydrogen production and connection variants
4.2. Investment and Operating Costs
The evaluation considers the full value chain of offshore energy delivery:
- Wind turbine and platform costs (20 MW turbine standard)
- HVDC export systems (525 kV VSC, offshore and onshore cable distances)
- Electrolysis systems (500 MWel PEM stacks on multi-level offshore platforms)
- AquaDuctus pipeline cost allocation (330 km offshore distance, capacity-based share)
- Operation, maintenance, and stack replacement costs over 25 years
- Weighted Average Cost of Capital (WACC)
The economic evaluation includes capital and operating expenditures for all major system components, incl. the proportional utilization share of the AquaDuctus pipeline. A uniform WACC of 9% and annual O&M costs of 2.6% of CAPEX were applied across all configurations.
In terms of investment cost, All E is the most expensive variant with approx. EUR 70 billion in total investment. All H₂ has the lowest CAPEX at approx. EUR 53 billion, due to reduced cable infrastructure. MC1 and MC2 lie in between, with MC2 (hydrogen-dominant) being slightly more cost-efficient than MC1. These costs also vary depending on the assumed commissioning year (2035 vs. 2040), due to learning curves, technology cost reductions (especially for electrolysers) [2], [3], and inflation effects.
4.3. Techno-economic evaluation
Revenues are calculated based on scenario-specific electricity and hydrogen prices and optimised dispatch and input for the economic evaluation. MC2 achieves the highest revenue across all scenarios and years, outperforming All H₂ and All E in almost all scenarios due to its ability to benefit from all markets. The bidirectional cable use in MC2 increases both cable and electrolyser utilisation, with average capacity factors rising up to 60%. MC1 generates slightly lower revenues, but still significantly more than a purely electrical setup.
All configurations result in negative absolute NPVs, highlighting the need for supportive policy measures or subsidy schemes. However, from a comparative perspective:
- As with revenues, MC2 consistently delivers the highest NPV and IRR across all scenarios and timeframes.
- It reduces the funding gap (subsidy requirement) by up to EUR +31 billion compared to All E.
- The bidirectional use of cables further improves economic performance by 1–2 percentage points in IRR.
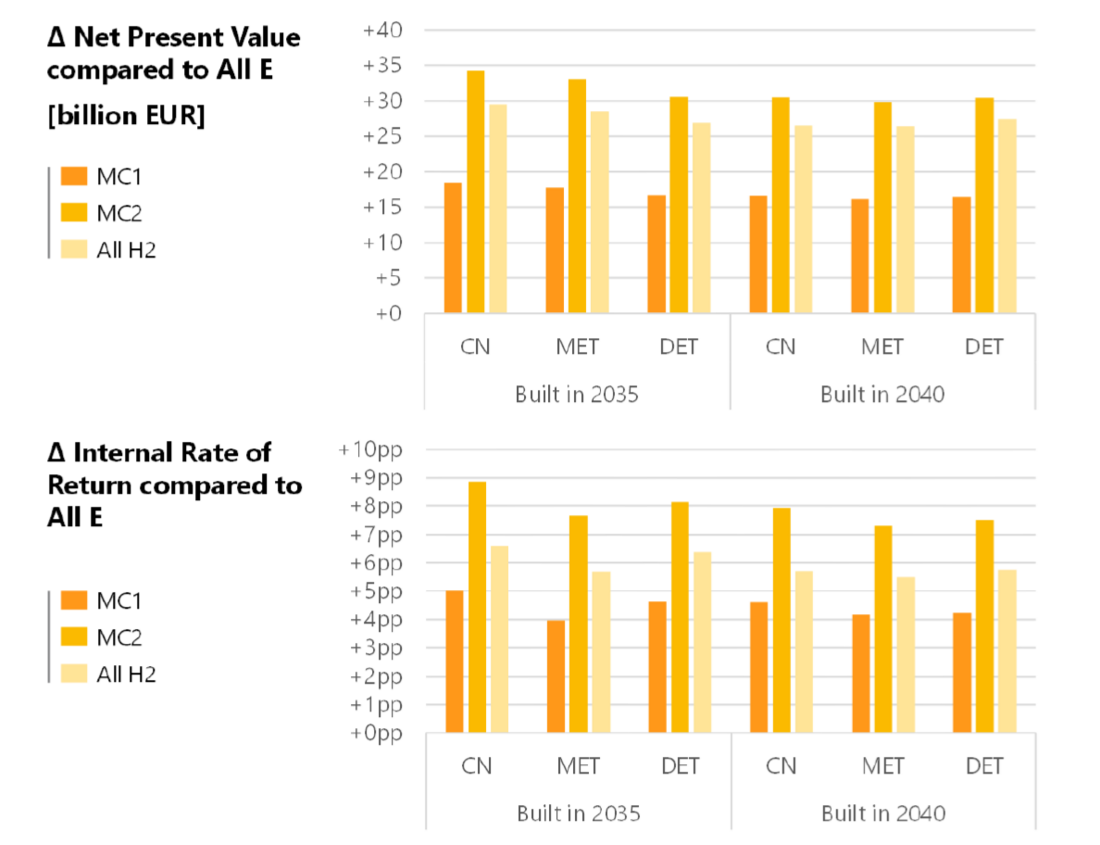
Figure 8 - Difference in NPV and IRR of connection concepts compared to All E
4.4. Key sensitivities and robustness
Several sensitivities were assessed to test robustness:
- impact of connection concepts on electricity market prices
- overplanting of electric capacity
- producing hydrogen onshore instead
The first sensitivity indicatively analyses the effect of the different connection concepts on electricity market prices, in comparison to the initial market prices that were calculated assuming an electric cable connection of 14 GW (cf. All E). Two different sensitivity calculations of the original All E case (chapter 3.2) were conducted for the reference year 2045:
- Only pipeline connection (All H2): 14 GW of offshore wind and 14 GWel of electrolysers are not connected by cable. Only a H2 connection by pipeline exists. Neither the offshore wind turbines nor the electrolysers can participate on the electricity market.
- Mixed connection concept (MC2): 14 GW of offshore wind and 10 GWel of electrolysers are connected by a 4 GW electricity cable and the pipeline. Offshore wind and electrolysers both participate on the electricity market yet constrained by 4 GW of cable capacity.
Using a mixed connection concept can mitigate the risk of higher electricity prices when using offshore wind predominately to generate hydrogen.
Besides connecting OWFs at full capacity, there is also the option to connect them electrically to the shore with a reduced cable capacity. Overplanting describes when more capacity is installed than can be transported. This sensitivity examines how a reduction in connection capacity in a purely electrical configuration (All E) contributes to an improvement in the economic evaluation – with 14 GW of OWFs installed.
In the sensitivity analysis, the optimal scenarios involve a 14 GW offshore wind farm (OWF) connected by a cable of 4 - 6 GW capacity. It implies that curtailing production to approximately one-third of the generation capacity results in the best economic performance. Consequently, it is more economical to curtail a substantial portion of electricity rather than invest in transmission infrastructure. At the same time, despite an improved IRR and NPV rating, 40% to 50% of the offshore energy must be curtailed which does not seem to be rational. Indirectly, the result indicates why a hydrogen-dominant mixed connection concept yields better overall results: a smaller electrical connection might be more advantageous overall.
So far, only concepts in which electrolysis took place offshore have been investigated. In the third sensitivity it has been investigated, if it would be cheaper to produce hydrogen onshore instead. In the following, onshore electrolysers are evaluated as part of the connection system. The 14 GW OWF are connected by a cable capacity of 14 and 10 GW. At their respective onshore grid connection points, electrolysers of the same size (14 GWel and 10 GWel) are connected. The sensitivity therefore investigates whether an electrical connection with subsequent electrolysis could be a more favourable concept. The hydrogen-dominant mixed connection concept MC2 yields the best results in all cases, both in terms of NPV and IRR. Offshore electrolysis reduces grid expansion, which justifies its higher construction costs. At the same time, MC2 maintains the flexibility of onshore configurations, which results in comparable revenue streams.
4.5. Conclusion of the techno-economic assessment
The techno-economic assessment demonstrates that hydrogen-dominant mixed connection concepts (MC2) are superior in terms of system flexibility, equipment utilisation, and socio-economic benefit. They combine the scalability of pipeline-based hydrogen transport with the market responsiveness of power exports — while reducing the need for massive electrical grid expansion. The results are consistent across all three energy scenarios and remain valid even under conservative cost and price assumptions.
5. Conclusions and recommendations
This paper demonstrates that hydrogen-dominant mixed connection concepts (MC2) provide the most balanced solution for integrating far-out offshore wind energy into the German energy system. They outperform purely electrical or purely hydrogen-based configurations in terms of:
- Techno-economic efficiency: Highest revenues, best asset utilisation, and lowest funding gap.
- System resilience: Flexibility to respond to both electricity and hydrogen market signals.
- Future readiness: Alignment with long-term energy system needs and infrastructure planning (e.g. AquaDuctus).
However, current German regulation blocks these mixed solutions. To unlock their potential, legal reforms are urgently needed, including a regulatory definition for mixed connections and permission for dual-use offshore platforms.
Recommended roadmap:
- Demonstration phase (by 2030): Enable pilot projects under regulatory exemptions.
- Scaling phase (2030–2035): Adapt the Offshore Wind Energy Act and associated grid/hydrogen laws.
- Commercial deployment (from 2035): Integrate MCs into national planning and auctions.
Enabling mixed connection concepts could strengthen the integration of offshore wind and green hydrogen and serve as a cornerstone of a resilient, flexible, and cost-effective energy transition.
Credit author statement
The paper serves as summary focussing on the techno-economic assessment of [4]. Further relevant references can be found in the study.
Conceptualization: H. Schwaeppe; G. Blumberg; P. Heuser; Methodology: H. Schwaeppe; G. Blumberg; P. Heuser; Data curation: C. Kneip; P. Heuser; A. Gelfort; Writing-Original draft preparation: T. Türkucar; Visualization: H. Schwaeppe; A. Schrief; C. Kneip; Investigation: H. Schwaeppe; A. Schrief; P. Heuser; G. Blumberg; Software: C. Kneip; A. Gelfort; Validation: H. Schwaeppe; G. Blumberg; P. Heuser; Writing-Reviewing and Editing: T. Türkucar; A. Schrief
References
- AFRY Management Consulting, 2022, Comparison of system variants for hydrogen production from offshore wind power
- PWC, 2023, Unit Investment Cost Indicators – Project Support to ACER
- DNV, 2023, Cost and performance data for offshore hydrogen production
- E-Bridge Consulting: Dr. Henrik Schwaeppe, Gerald Blumberg, Dr. Philipp-Matthias Heuser, Alexander Schrief, Andreas Gelfort, Christopher Kneip, Dr. Christian Schneller, Tuncay Türkucar, PGU: Dr. Ute Schadek, Florian Maiwald, Frank Bachmann, Dr. Lesley Szostek, Anika Freund, 2024, Assessment of connection concepts for Germany’s far out North Sea offshore wind areas for an efficient energy transition.