Detection of Construction Sites Near Infrastructures Using Satellite Technologies
Authors
Mandana TALEB, Antoine BOIVIN - RTE, France
Maria PAPADOMANOLAKI, Alexander BLAUW - Orbital Eye, Netherlands

Summary
Electricity transmission networks are sometimes exposed to third-party activities that take place close to overhead lines or underground cables. These activities, such as construction work, excavation, or material storage, can create safety risks or lead to damage if they are not detected in time. In most cases, such works are declared to local authorities and known by grid operators. However, some activities may start without any formal declaration and so cannot be monitored by operators. For this reason, having additional monitoring tools can help improve network security and support field teams.
This paper presents the results of an experimentation that tested a satellite-based approach to detect third-party activities near transmission infrastructure. The project was carried out during the Olympic and Paralympic Games in Paris in the summer of 2024. It covered a 70-kilometre zone including both RTE’s overhead lines and underground cables. The objective was to check how satellite images and artificial intelligence could help detect potential risks in near real-time.
The monitoring method used a combination of satellite images, including optical, radar, and multispectral data. Every week, a first analysis was made using medium-resolution images to detect changes in the landscape. Then, high-resolution images were used to zoom in on the areas where changes were found. These images were analysed by algorithms to identify the presence of construction sites, heavy machines, vegetation works, or storage near the infrastructure. The results were then reviewed and confirmed by operators using a dedicated platform.
During the two-month test period, the system detected 165 potential activities, which were grouped into 64 different events. After review, 95% of these events were confirmed as real, with only three false alarms. The detections were located in various types of areas, including suburban and industrial zones. The use of radar also made it possible to keep monitoring during cloudy weather, which can be a limit for optical images.
This experimentation showed that satellite-based monitoring can be a useful tool to support existing grid surveillance practices. It offers a way to monitor large areas with good accuracy, even in complex environments. It can also help detect activities that are not declared or visible through traditional methods. The results are promising and show potential for future integration.
The paper ends with a discussion about how such a system could be integrated into real grid operation workflows, and what steps are needed to make it fully operational in the future.
Keywords
Construction Site, Infrastructure Safety, Detection, Monitoring, Remote Sensing, Risk Prevention, Satellite Imagery, Artificial Intelligence1. Introduction
Monitoring third-party activities near electricity transmission infrastructure is a growing operational challenge. Construction works, excavations for example can pose serious risks to both overhead lines and underground cables if not detected early. While grid operators rely on field patrols and administrative declarations to track such activities, these traditional methods have limitations: they are resource-intensive, environmentally harmful and often unable to provide full visibility over large or complex areas. Such conditions can affect the timely reactions and proper measures that need to be taken depending on the activity, increasing the chances of serious accidents.
In parallel, recent advances in satellite imagery and automated analysis are opening new possibilities for infrastructure monitoring. These technologies offer a way to observe wide territories with regular frequency. Their potential lies in their ability to observe environmental changes and identify potentially dangerous activities on time.
In this context, RTE initiated an experimentation in collaboration with a technology provider, to assess the relevance of a satellite-based monitoring approach under real operational conditions. The aim was to understand how such a solution could contribute to detecting potential third-party interferences (TPIs) with sufficient accuracy to support decision-making in the field. This paper presents the main objectives, implementation, and outcomes of this experimentation.
2. Objectives and Experimentation Setup
2.1. Motivation and Context
Recent advances in satellite technologies and artificial intelligence have significantly expanded the possibilities for large-scale, automated infrastructure monitoring. High-resolution imagery is now available at increasing frequency, and AI-powered algorithms make it possible to analyse environmental changes and classify relevant activities with growing reliability.
For Transmission System Operators, these developments come at a time when third-party activities around critical assets are becoming more frequent, more diverse, and sometimes harder to control. Construction sites, earthworks, storage zones or vegetation operations—especially when undeclared—can pose serious threats to both overhead and underground infrastructure. Traditional detection methods, such as manual inspections or declared work notifications, often leave gaps in coverage or suffer from reporting delays.
In this context, RTE identified the need to explore new solutions capable of providing independent and regular insights on what happens near its infrastructure. The motivation for launching this experimentation was to evaluate whether a satellite-based detection approach could serve as a complementary layer to existing surveillance tools, helping detect early signals of risk and strengthen overall network safety. Rather than testing a specific product, the initiative aimed to assess the operational value of this type of monitoring under real-world constraints, and to better understand how it could be integrated into field practices in the future.
2.2. Objectives of the Experimentation
The experimentation aimed first and foremost to technically evaluate a satellite-based monitoring solution capable of detecting third-party activities near transmission infrastructure. The goal was to test whether such a system could deliver reliable alerts with an acceptable rate of false positives and identify relevant events with sufficient accuracy and responsiveness for operational use. Beyond this core performance assessment, the experimentation also focused on the usability of the solution by field teams. It was essential to determine whether the system’s interface, alert formats, and classification options were intuitive and easy to integrate into daily workflows. Particular attention was given to the way alerts could be reviewed, filtered, and confirmed by maintenance personnel within realistic time constraints.
In that sense, the project was not limited to validating detection algorithms but extended to evaluating the overall ergonomics of the tool and its capacity to support real-time decision-making in the field.
By addressing both technical and operational dimensions, this experimentation served as a first step in assessing whether such a monitoring solution could bring tangible value to a TSO and how it might eventually be integrated into standard surveillance practices.
2.3. Experimentation Environment and Conditions
The experimentation was carried out over a 70-kilometre corridor of RTE’s infrastructure located near Paris. The monitored assets included both overhead lines and underground cables. The area was chosen to represent a mix of environments: urban centres, peri-urban developments, industrial zones.
Alerts considered potentially critical were shared as soon as possible via mail and a a dedicated web application, allowing operators to access satellite imagery and preliminary classifications in near real-time. In addition to these regular updates, a report summarising the newly detected events was delivered each week to RTE’s teams. Importantly, the experimentation was carried out under standard operating conditions. No additional resources or adaptations were introduced. The objective was to evaluate the added value of the monitoring solution within existing workflows, and to observe how field teams could interpret and act on this new layer of information without procedural disruption.
The detection corridors were defined as 50 meters around the overhead lines and 30 meters around the underground cables, ensuring comprehensive coverage of the surroundings. All types of construction machinery were monitored, including cranes, aerial work platforms, drilling machines, and other construction-related activities. The acquisition frequency was carefully optimized: optical imagery was acquired daily, while SAR and multispectral data were acquired every 2 to 4 days. This high-frequency data collection enabled near-continuous monitoring, reinforcing the effectiveness and relevance of the solution. All these parameters detection: corridor size, types of activities monitored, and acquisition frequency, are fully adjustable depending on operational needs, specific use cases, and the costs envisaged, offering a highly flexible and scalable approach to infrastructure monitoring.
3. Methodology and resources
3.1. Satellite-based Detection Approach
The satellite-based detection of potentially dangerous activities offered by the technology provider consists of interrelated processes that together resulted in efficient earth observation monitoring.
As a first step, open satellite imagery was automatically analysed for the entire network. A time-series of satellite images was built, and a change detection algorithm was used to identify potentially relevant activities. The identification of relevant activities was achieved with the help of artificial intelligence models trained to recognize environmental changes and unusual disturbances.
After identifying critical areas through the open data, high resolution commercial images were automatically tasked on a weekly basis showing all the intricate geographical details concerning the regions of interest. The automatic tasking algorithm is optimised to task only areas where (1) new changes were detected and (2) ongoing activities are happening. This optimisation makes sure only the areas with relevant activities are targeted by the commercial high-resolution optical satellites. In this way even very small activities become visible and an excavator vehicle in a field can be identified. All the model observations were then processed and filtered by data analysts during quality control who kept only the necessary information (e.g construction works, vegetation clearances etc.).
Through this synergy, the final findings were determined and were immediately sent to RTE for daily validation and were also summarized at the end of every weekly reporting cycle. Such an approach can greatly benefit the monitoring process of large networks since the field inspections are reduced, concentrating only on the reported locations. In this way, field patrols can be optimized to focus on specific events and action can be prioritized depending on the satellite images. This monitoring pattern is less time consuming and more environmentally friendly.
3.2. Data Sources
As already mentioned in the previous section, sources of data with different sensors and resolutions were acquired in order to monitor the network. The fusion of different satellite sources is key to have a reliable monitoring system that can capture all aspects of relevant activities. Three types of satellites are used:
- Synthetic Aperture Radar (SAR) satellites from the European Space Agency’s Sentinel-1 constellation, play a critical role in monitoring human activity. These radar satellites are particularly effective in detecting man-made objects, including excavators, support infrastructure, and other man-made structures. As active sensors, they operate continuously, both day and night, and possess the unique capability to penetrate cloud cover. These attributes make SAR satellites a mandatory component of the monitoring system.
- Multi-spectral (MS) satellites of the Sentinel-2 constellation by the European Space Agency, provide essential data for Earth observation with open accessibility and 10
-meter spatial resolution. MS satellites capture imagery across a broad range of wavelengths, including the visible and near-infrared spectra. The near-infrared bands are particularly valuable for detecting changes in vegetation, which often serve as indicators of relevant activities such as land clearing, excavation, or early-stage construction activities. As a result, MS data is highly effective for identifying both ongoing and completed groundworks. In cloud-free conditions, these satellites can reliably reveal residual signs of such activities.
- High-resolution (HR) optical satellites, operated by various commercial providers, offer imagery with spatial resolutions ranging from 30 to 50 centimetres, enabling detailed observation. These satellites typically achieve high revisit frequencies—often several times per day—allowing for rapid acquisition of optical data, provided that atmospheric conditions are cloud-free. HR imagery is utilized to validate and contextualize activities initially detected by SAR and MS satellites. The fine spatial detail offered by HR satellites supports precise interpretation of changes and contributes to comprehensive, multi-sensor monitoring strategies. Since urban regions were included in the RTE area of interest, high resolution optical data of 30cm resolution were mainly employed in order to ascertain that all details were captured. If allowed by the circumstances, peri-urban areas and large fields were handled using 50cm resolution optical data.
A summary of all sources is provided in Table 1. The radar and multi-spectral sources are open data and used to scan all the network every 2 to 4 days. On a weekly basis, the high-resolution optical sources were tasked. These constellations pass over multiple times per day allowing them to capture an image as soon as there is a cloud free moment.
| Source | Provider | Type | Sensor | Resolution | Frequency |
|---|---|---|---|---|---|
| Sentinel-1 | ESA | open | SAR | 5 - 15 m | 2 - 4 days |
| Sentinel-2 | ESA | open | multi-spectral | 10 m | 2 - 4 days |
| SkySat | Planet | commercial | optical | 50cm | daily |
| Pleiades-Neo | Airbus | commercial | optical | 30cm | daily |
An overview of a reporting cycle is shown in figure 1. Sentinel-1 and 2 data are analysed on almost a daily basis. Once the high-resolution satellites are tasked then also these satellites start to acquire data over the network where relevant activities are taking place. Firstly, Sentinel-1 and Sentinel-2 imagery is ingested into the system. An advanced change detection algorithm filters all irrelevant changes. Next, high resolution optical satellites actively task and collect images near all relevant changes. Finally, the relevant locations together with recent high resolution optical images are reported. The illustrated timeline shows an example of a standard reporting week. Satellite data is ingested on almost a daily basis. Relevant activities are reported daily, and a final summary report is gathered at the end of the cycle.
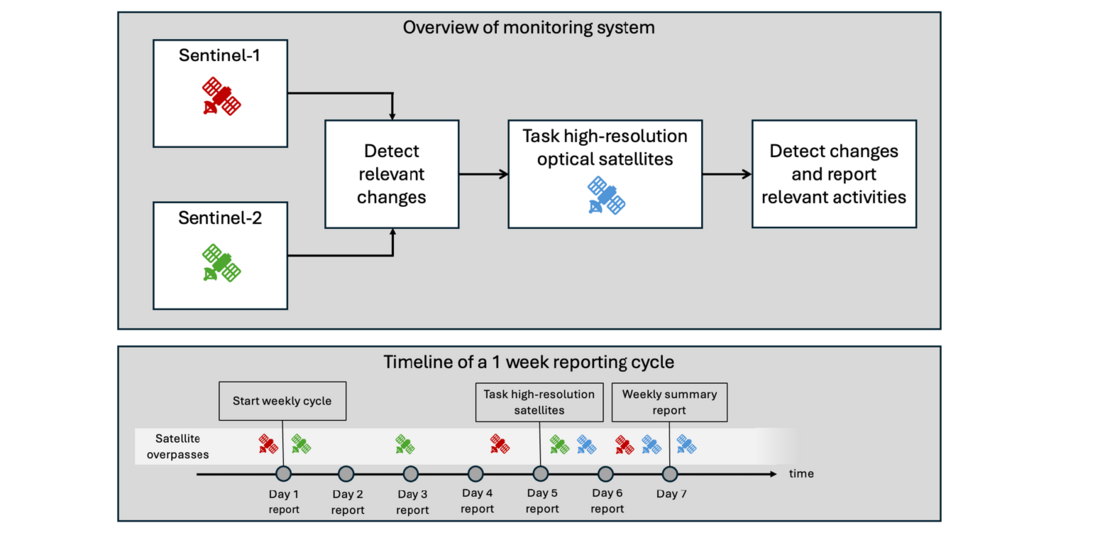
Figure 1 - Simplified flowchart of the system workflow
The combination of satellite sources ensures all components of a third-party activity are detected. A third-party indicator (TPI) consists of multiple components such as equipment on site and often a decrease in vegetation. As highlighted in Figure 2, radar satellites, multi-spectral and high-resolution satellites capture all components of relevant activities. Figure 3 shows an example of groundworks visible in a high-resolution optical satellite image. Different elements of the activity are detected by the radar and multi-spectral satellites. The fusion of the different sources allows the system to identify these groundworks, which in this case are confirmed by the optical image.
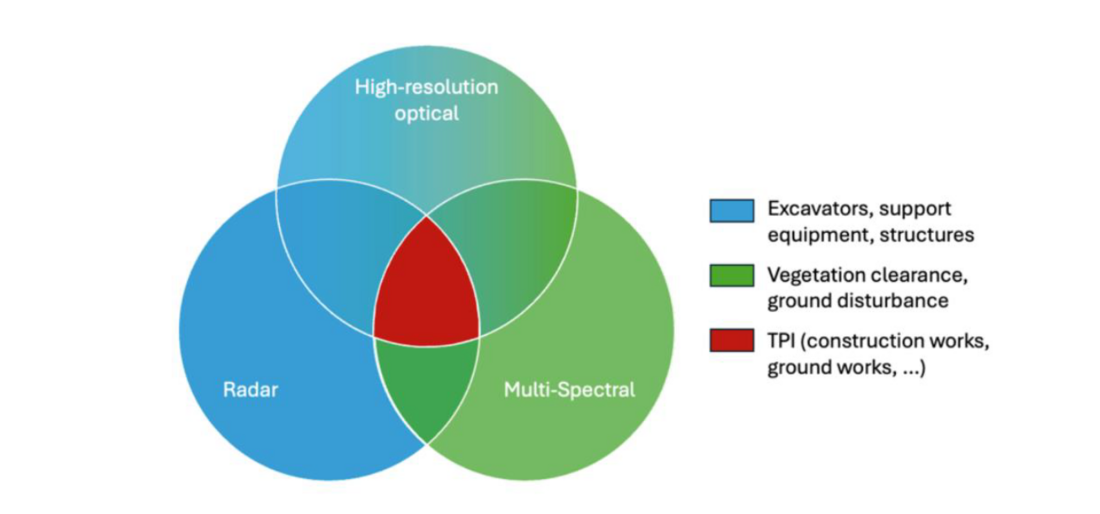
Figure 2 - Breakdown of the type of activity per satellite sensor that together make up a TPI. Man-made objects (blue) are detected by the radar and high-resolution optical satellites. Vegetation related activities are mainly detected by multi-spectral and high-resolution optical images
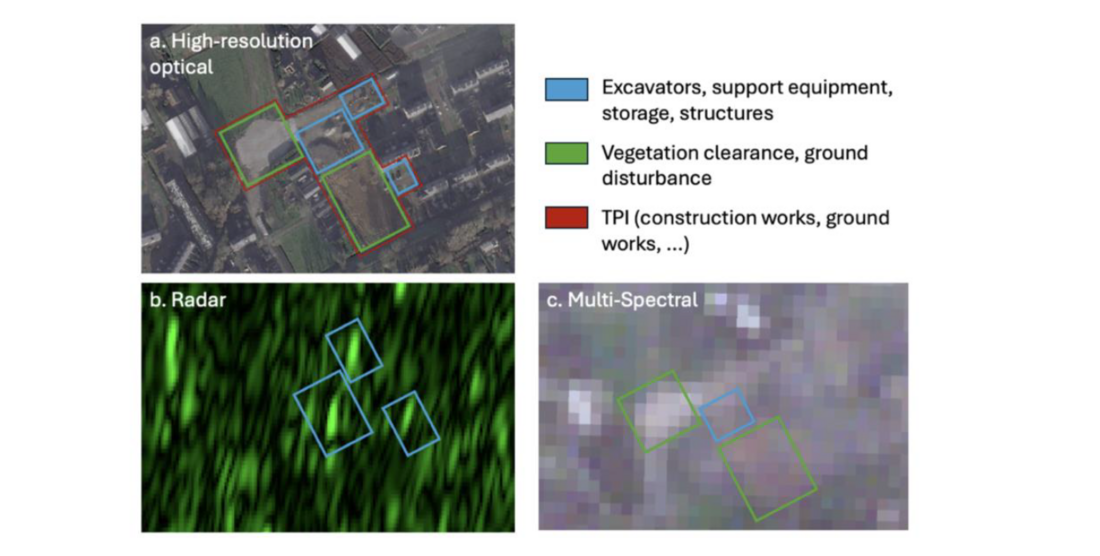
Figure 3 - Satellite images per source showing the parts of a construction site detected by each sensor type. (a) shows a high-resolution optical image of the entire construction site, (b) shows the amplitude of the radar signal detecting an excavator, storage site and support equipment and (c) shows a multispectral (RGB) image detecting ground levelling, a storage site and vegetation clearance. (a. © Airbus DS (2025), b/c, Copernicus Sentinel data (2025))
3.3. AI-Powered Analysis
Artificial intelligence models play a crucial role in the monitoring process since they indicate and classify automatically all the environmental changes, based on the various satellite sources that were introduced in the previous section. More specifically, change detection algorithms identify suspicious activities in the radar and multi-spectral data based on which the most relevant areas are recognized, and corresponding high-resolution optical images are automatically tasked in order to zoom in and confirm any detected activities.
A second change detection model is then applied also on the optical images. Specifically, the model is trained to receive bi-temporal image pairs that depict the same region in two different time points and identify the changes between them. In this way, at every reporting cycle the model receives both the current image as well as an image of the recent past and compares them, determining the locations where changes have occurred. The final detected events depend not only on the change detection process, but also on an ensemble of additional algorithms that have been developed.
Almost equally important is the co-registration algorithm that ensures the image pairs are perfectly aligned before change detection is performed. Often, displacement distortions are visible in given image pairs, even though they belong in the same coordinate system. This can deteriorate the performance of the change detection algorithms and result in many unnecessary false alarms. For that reason, proper image alignment is a prerequisite for the successful detection of environmental changes.
Furthermore, a vehicle detection model identifies suspicious vehicles e.g trucks or excavators on the latest available optical image. This is especially useful as sometimes a single excavator can appear in a field where no other change has taken place yet, indicating for example the beginning of potential ground works. In Figure 4 a vehicle detection example is provided.
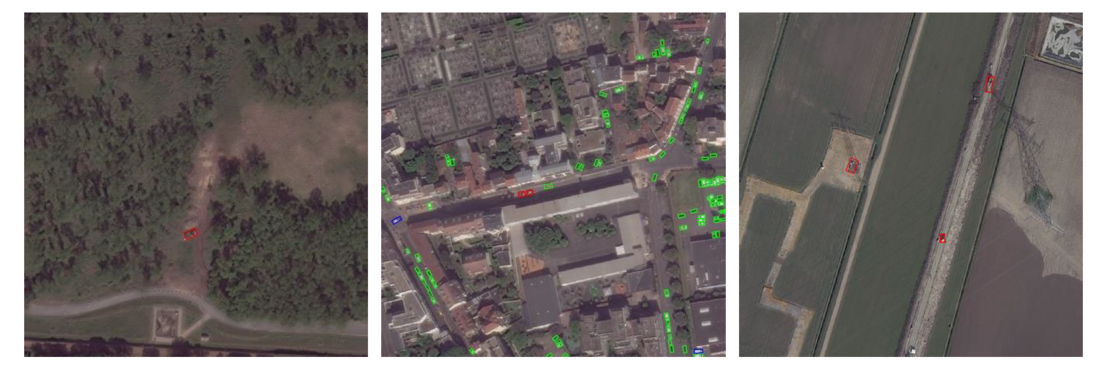
Figure 4 - Example of vehicle detection model detecting excavators (red), vehicles (green) and trucks (blue) in high-resolution optical images. From left to right, an excavator is detected in a remote area indicating starting groundworks, two excavators are detected indicating ongoing road works and three excavators are detected near overhead lines. (© 2025 Maxar, © 2025 Maxar, (© Airbus DS (2025))
As far as clouds are concerned, a cloud detection model ensures that all cloud covered regions are filtered out of the change detection process. Radar data are instead utilized for these regions to judge whether suspicious activities have occurred or not.
Combining all data sources and artificial intelligence algorithms, the system detects all the events that can pose a threat to the infrastructure. Subsequently, the detected events are reported to the analysts who examine the different data sources manually for a final quality control. This whole process takes place on a daily basis and if any events are confirmed as a threat by the analysts, they are reported to RTE and become visible in the dedicated web application for review by the operators.
3.4 Operational Workflow
At the end of every reported cycle, the final critical events collected through the synergy of artificial intelligence and data analysts were sent to RTE. The operators were then able to look into all the reported locations with the help of an interactive web application developed by the technology provider that contained not only map locations but also corresponding satellite views of the scenes. Additional comments were also provided explaining the nature of each activity (e.g construction works, vegetation clearance, storage activity etc.). Based on this information the operators could then arrange field visits to the provided locations and further evaluate the margin of the threat to the infrastructure.
4. Key Results and Analysis
4.1. Main Performance Indicators
Over the two-month monitoring period, the system generated a total of 165 third-party interference (TPI) alerts, which were consolidated into 64 unique activities after grouping recurring detections at the same locations. Each activity had to be reviewed and classified by experts to determine whether it represented a real risk to infrastructure.
This classification phase, although necessary, proved to be time-consuming for maintenance teams. Nearly half of the detected events were not relevant from an operational perspective, either because the activity posed no risk or was located too far from the infrastructure. In addition, most of the alerts were for work construction events that were already known and under control. As a result, a significant share of the effort was spent analysing alerts that did not require action, which impacted the efficiency of field operations.
Nevertheless, among the 64 unique activities, 61 were confirmed as relevant third-party activities, and only 3 were identified as false positives, resulting in a precision rate of 95% as described in the table 1. This demonstrates the system’s high capacity to detect real events, even in complex environments.
Despite the time required for classification, the solution was well received by the field teams, who appreciated its simplicity and intuitive interface. The learning curve was minimal, and the ability to visualise detections quickly, through a dedicated web application, could help integrate the tool smoothly into operational routines. Teams clearly recognised the added value of receiving external alerts that could reinforce and guide their surveillance efforts.
| Indicator | Result |
|---|---|
| Operator feedback - Ergonomics | Simple and intuitive interface |
| Operator feedback - Added value | Useful for risk anticipation and field prioritisation |
| Total alerts generated (TPIs) | 165 |
| Unique activities identified | 64 |
| Confirmed relevant activities | 61 |
| False positives | 3 |
4.2. Typology and Nature of Detected Activities
The third-party activities detected during the experimentation covered a wide range of situations, with varying degrees of relevance and associated risk for transmission infrastructure.
Most validated alerts were linked to ground works, which represented over 60% of the unique events. This category included construction sites, excavation zones, roadworks, and machinery deployment—activities that are typically associated with a higher level of risk. Other types of TPIs identified included:
- Vegetation-related activities (17%), such as ground clearing near overhead lines. While visible in the imagery and correctly flagged by the system, these interventions were, in most cases, assessed as non-threatening by RTE experts and did not require further action.
- Temporary storage (6%), including materials, containers, or construction equipment placed near the right-of-way. These cases were more ambiguous and often required additional context to assess their level of risk and could be a real issue on the underground cables work site.
The figures 5, 6 and 7 show us an example of a TPI with different views accessible from the web application.
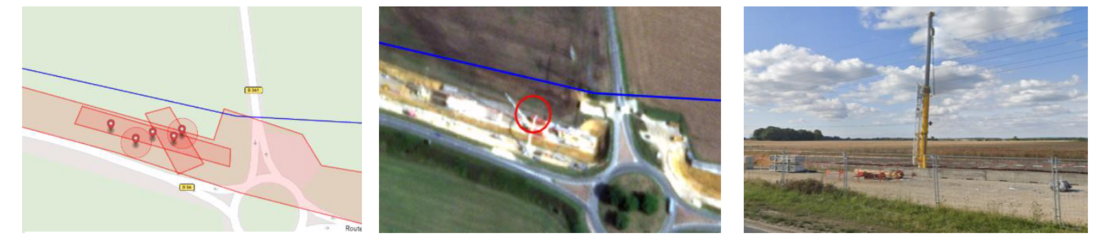
Figure 5 (left) - Example of TPIs detected on a construction site.
Figure 6 (middle) - Example of the optical view of one specific TPI.
Figure 7 (right) - Example of the street view of the same specific TPI
5. Operational Insights and Perspectives
5.1. Lessons Learned from the Experimentation
This experimentation confirmed that satellite-based monitoring can provide valuable support to transmission asset surveillance. Several key lessons emerged from the field experience, both in terms of technical performance and operational relevance.
- First, the system demonstrated a strong capacity to detect a variety of third-party activities, with a high level of precision and relatively low noise. This accuracy is essential to ensure that alerts are actionable and trusted by operators.
- Second, the frequency of analysis proved sufficient to capture most relevant events. While real-time detection is not yet achievable with satellite imagery alone, a regular cadence can still offer a useful compromise between coverage and reactivity.
- Third, the experiment highlighted the importance of human interpretation and operational context. While the alerts generated were generally accurate, the final qualification of each activity still required expert judgment, particularly to assess the real level of risk to the infrastructure. This need for manual classification is currently a limitation, as expert input is essential to train and refine the models. However, this is a necessary and transitional phase: as the models are exposed to more high-quality, classified data, they will progressively learn to generate reliable alerts autonomously, without the need for manual validation. From an integration standpoint, the non-intrusive nature of the monitoring solution and the minimal effort required from field teams were recognized as major strengths. Alerts were delivered through a simple web-based interface, requiring no changes to existing procedures, which made the experimentation easy and seamless to implement.
- Last, the experiment highlighted the need for clearly defined and operationally grounded use cases. While the system demonstrated its technical capacity to detect a broad range of third-party activities, its operational value depends heavily on how well the detections align with actual field priorities. Generic or poorly framed alerts can create unnecessary workload, dilute attention, and reduce the perceived usefulness of the tool. In contrast, when the monitoring is focused on precise and high-impact scenarios, such as the detection of undeclared worksites near sensitive lines, the surveillance of critical access tracks, or the early identification of high-risk equipment like cranes or drilling rigs, the alerts become truly actionable and directly support decision-making.
These findings provide a solid foundation for considering the next step: a more structured pilot project, aiming to evaluate long-term performance and integration into existing operational workflows. However, this perspective remains exploratory at this stage, and further technical, organisational, evaluations will be necessary before any implementation decision.
5.2. Towards Operational Integration and Strategic Outlook
The experimentation confirmed that satellite-based monitoring can deliver valuable insights with minimal disruption to existing practices. However, for such a solution to be meaningfully integrated into operational routines and bring its full value, several key conditions must be addressed.
- First, the alert review process must be fully aligned with field risk management practices. Clear criteria need to be developed for alert prioritisation, risk classification, and correlation with existing asset data. The objective is to ensure that satellite-based detections become part of a broader decision-support ecosystem, rather than isolated signals.
- Second, the digital interface must be robust, intuitive, and interoperable with existing monitoring or asset management systems. Infrastructure experts must be able to easily visualise, validate, and archive alerts. Additionally, continuous feedback loops must be implemented to refine detection algorithms over time and progressively improve alert relevance.
- Third, operational teams must be involved from the early stages of deployment. Their input is crucial to ensure that the tool meets real operational constraints and contributes to tangible improvements in surveillance efficiency. Co-designing the solution with end-users will be key to driving adoption and maximising impact.
- Fourth, the detection system must be guided by clearly defined and high-impact use cases. Rather than relying on generic alerts, the solution should target specific operational risks where it can deliver immediate value. Key examples include:
- Monitoring the construction of access tracks to pylons, verifying the actual surface area completed and compliance with planned works.
- Detection of undeclared construction activities, identifying new worksites that have started without prior notification.
- Surveillance of particularly sensitive overhead lines, where third-party activities could pose major safety or operational risks.
- Monitoring of high-risk construction sites, especially where ground disturbances might endanger underground cables or critical infrastructure.
- Finally, the operational cadence must be adapted to the context. While a weekly analysis is appropriate for general monitoring, high-risk zones or fast-evolving worksites may require shorter revisit intervals or dynamic tasking to ensure a timely response.
While the experimentation did not aim for full integration, it successfully identified these essential prerequisites. They now serve as a strong foundation to design a more advanced pilot phase, where the goal will be to validate the solution’s operational relevance, scalability, and ability to strengthen grid surveillance practices in the long term.
5.3. Adaptability Across TSOs: Geographical and Seasonal Considerations
The satellite-based monitoring solution developed and tested in this study has demonstrated potential for adaptation across different TSOs. The current study took place in France over summer, but the solution is applicable to TSOs regardless of their geographical location and network configuration. Over the past years, the system has been deployed and validated in collaboration with mainly gas TSOs operating under a wide range of environmental conditions showcasing year-round performance around the world.
A key part of the solution lies in its use of radar (SAR) data, which ensures reliable monitoring independent of weather conditions or cloud cover. This makes the system inherently robust for year-round deployment, including during winter months when optical imagery may be limited or unreliable.
In terms of data processing, the AI algorithms supporting the detection and classification pipeline have been trained on diverse global datasets, yielding a baseline performance of approximately 90% in new regions upon initial deployment. The remaining 10% of optimization is typically specific to local context—such as landscape features, network layout, or construction patterns—and can be effectively addressed in the early months of operation. This adaptive phase is essential for fine-tuning the system to the specific needs and operational standards of each TSO.
Regarding the use of high-resolution optical imagery, results suggest that 50 cm resolution is sufficient for both rural and suburban areas with relatively low structural density. In these environments, the system maintains high detection accuracy without performance degradation. However, in dense urban areas with tall buildings or complex visual obstructions, the use of 30 cm optical data is recommended. This higher resolution supports improved classification confidence and assists operators in interpreting the detected activities within the application environment.
In summary, these factors suggest that the methodology in this study is transferable to other TSOs, with proven reliability across seasons and a technical foundation that allows for regional and operational customization.
6. Conclusion
This experimentation demonstrated the operational relevance of satellite-based surveillance for detecting third-party activities near electricity transmission infrastructure. By combining multi-source imagery with automated analysis, the system achieved a 95% accuracy rate in identifying potentially hazardous events. While further work is needed to fully integrate the solution into existing field workflows, the field teams responded very positively to its potential. Although expert validation is still required, the tool’s intuitive interface and clear alerts facilitated rapid adoption by operational teams.
These promising results support further exploration of the technology’s potential, particularly for high-value use cases such as detecting undeclared worksites, monitoring sensitive zones, or tracking the evolution of ongoing construction activities.
A broader pilot phase will be essential to optimize the technical parameters, assess performance gains in specific use cases, and confirm the prerequisites for full-scale integration into RTE’s operational systems.
More broadly, this approach addresses challenges that are widely shared across the transmission sector. As urbanisation accelerates and third-party activities grow in volume and complexity, satellite-based monitoring could become a strategic asset for TSOs seeking to strengthen infrastructure safety, optimise field operations, and move toward more predictive maintenance models.
References
- Blauw, A., van Haver, S., & van den Berg, A. (2025). 10 years of satellite-based right-of-way monitoring: Reflecting on the past and shaping the future. Proceedings of the 20th Pipeline Technology Conference.
- Blauw, A., van den Berg, A., & Schoonbeek, B. (2024). Gasunie and Orbital Eye – Operational assessment of satellite-based right-of-way inspections. Proceedings of the 19th Pipeline Technology Conference.