New Zealand Distribution Network Protection Practices: Industry Survey Analysis
Author
Nirmal-Kumar C. Nair - CIGRE Distinguished Member, New Zealand

Summary
Smart grid infrastructure is growing in New Zealand by adopting modern technologies. In particular, the increasing number of grid-connected Distributed Renewable Generation (DRG) units has introduced new challenges for the protection of distribution networks. DRGs can contribute additional fault current during abnormal conditions, which may impact the performance of traditional protection devices and coordination schemes. As a result, it has become increasingly important to evaluate how these generators affect fault levels and to ensure that protection systems operate reliably and safely under these evolving conditions
This paper summarizes the major findings of a comprehensive survey on utility practices for the protection of New Zealand distribution networks. The results offer a clear picture of how utilities are adapting their protection schemes to accommodate DRG integration, highlighting both challenges and best practices. It is the first survey of its kind conducted in New Zealand.
Keywords
Smart Grid, Distribution Network Protection, Distributed Renewable Generation (DRG)1. Introduction
In the smart grid era, distribution automation is the key topic. Pushing protection specialists to optimize the distribution protection and control as in the transmission system. A New Zealand national project, was aimed to develop smart methods and guidelines for protection and automation in the distribution network with bidirectional flows. To support this, a comprehensive survey was conducted, which is the first comprehensive survey of its kind for New Zealand. The aim of the survey was to understand the existing protective devices, schemes and practices used by distribution utilities to ensure the protection, selectivity, sensitivity, speed and reliability of their network.
The survey questionnaire was designed similar to the international surveys which started in US in 1980s and resulted in a series of publications [1] - [5]. Some specific questions were added to the questionnaire that are relevant to New Zealand like Single Wire Earth Return (SWER) system. Responses came from 11 out of the total of 29 distribution companies, representing 80% of all distribution utility consumers. A detailed report was released in 2014 based on the information provided by the respondents [6]. Fig, 1 summarizes different protection devices used in the New Zealand distribution system.
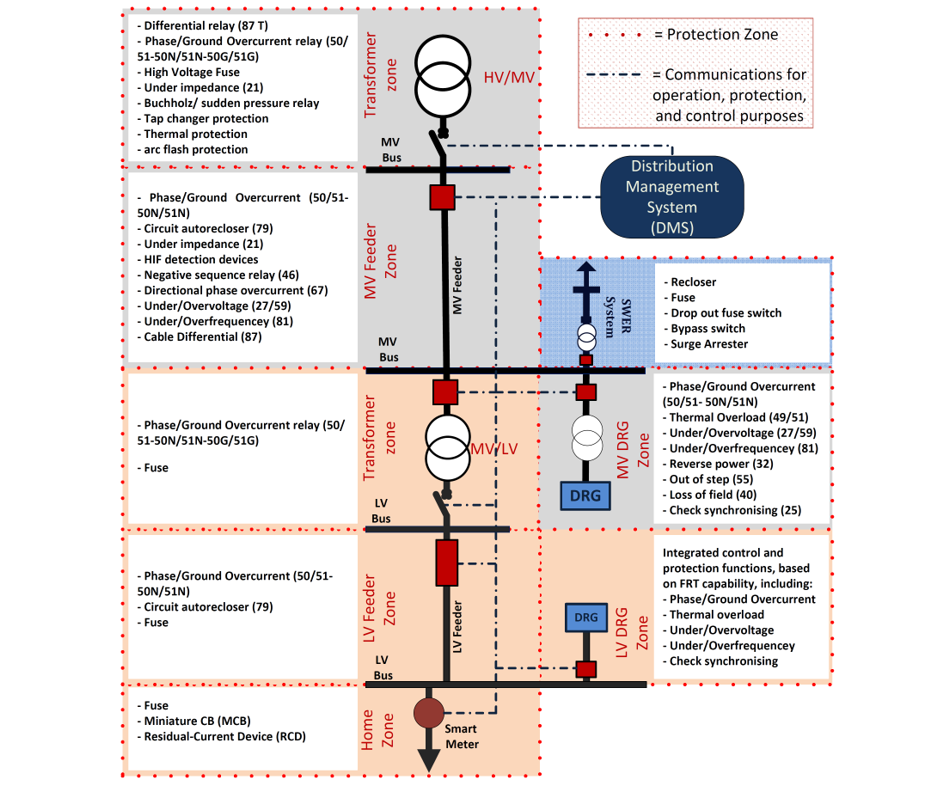
Figure1 - A typical MV/LV distribution network in New Zealand. The protection devices of different zone are listed in the boxes with the ANSI codes
This paper summarizes and analyzes the major findings of the survey to find out the opportunities and the feasibility for standardizing the existing protection schemes in the Smart Grid frame work.
The paper is organized as following: The sections II –IV cover survey result, and the final section concludes by providing insights into how the survey results can assist New Zealand distribution utilities. Specifically, it highlights their preparation for the integration of large-scale renewable distributed generation and storage technologies. These include rooftop solar panels, solar farms, home batteries, grid-scale batteries, and sub-transmission connected wind farms. Such developments are expected in the coming decades to support New Zealand’s commitment to the Zero Carbon Act.
2. Utility General Information
Each utility was asked to state their total distribution load and distribution station supply transformer size by voltage class. The system load is shown in Fig.2.
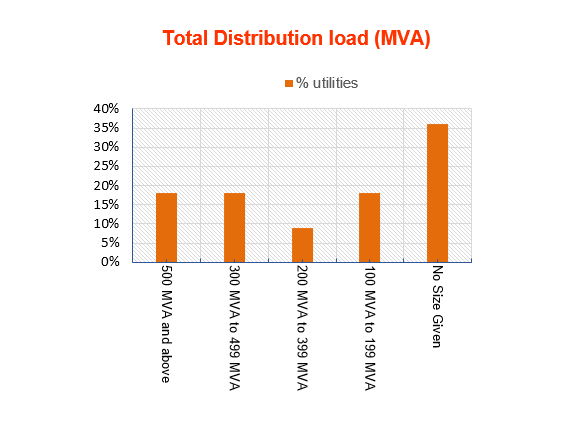
Figure 2 - Total distribution load of utilities.
Most utilities operated in multiple distribution voltage classes, with 11 kV and 33 kV being the predominant classes, collectively accounting for over 77% of the total load. Table I provides a breakdown of the typical total transformer capacity and the total number of transformers across the utilities surveyed.
| Transformer Size | Number | Utilities (%) |
|---|---|---|
10 MVA or below | 182 | 90 |
10 - 20 MVA | 260 | 90 |
20 - 50 MVA | 239 | 81 |
50 – 100 MVA | 13 | 9 |
> 100 MVA | 0 | 0 |
3. System data
3.1. Transformer Connection Type
Delta–Wye grounded is the predominant distribution transformer connection applied to the system by the distribution utilities. 36% of respondents are using delta – wye with resistor grounding transformers. Neutral Earthing Resistors (NER) is used by 4 utilities.
3.2. Transformer Design
Main breaker is the most common design practice used by the respondents on the HV and LV sides of transformers. Fig.3. shows a comparison of the transformers HV and LV design practices.
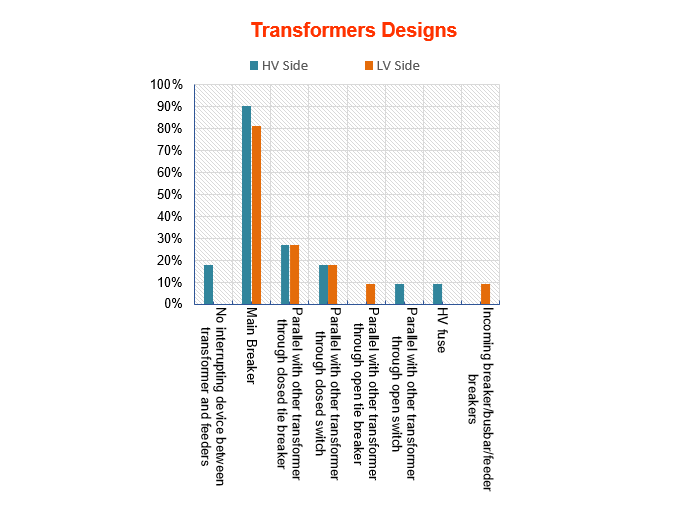
Figure 3 - Transformers designs
3.3. Line devices
When asked what types of line devices are applied in significant numbers of your distribution feeders, the following responses were received (Table II).
| Device | % |
|---|---|
Main feeder circuit reclosers | 90 |
Branch circuit reclosers | 72 |
Main feeder circuit sectionalizers | 45 |
Branch circuit sectionalizers | 54 |
Branch circuit fuses | 72 |
Unfused single-phase taps | 9 |
3.4. Transformer protection
When asked about the typical protection practices for large or higher voltage transformers, the answers in Fig. 4 were received. The other cases were Buchholz (36%), Thermal protection (27%), Under impedance (9%, in modern sites), Tap changer pressure relays (9%), Tap changer fail/run away (9%), and Arc Flash (9%, on some indoor switchgear).
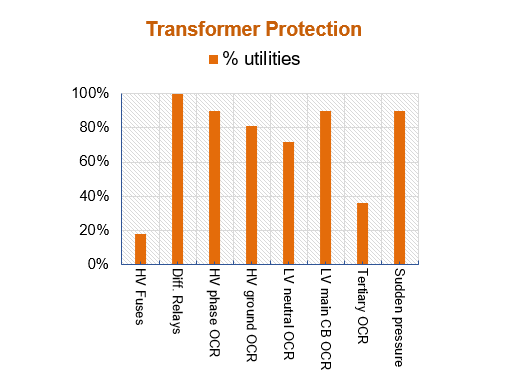
Figure 4 - Summary of the transformer protection practices in NZ distribution utilities
More than 90% of the respondents replied that they apply ground current protection to the transformer low side main interrupting device. It was indicated that the criteria shown in Table III are used to establish pickup settings for ground time overcurrent protection.
| Criterion | % |
|---|---|
Percent of transformer full load current | 36 |
Percent of transformer normal, maximum load | 18 |
Percent of phase trip pickup level | 18 |
Percent of multiple of largest feeder maximum load | 0 |
Multiple of feeder ground device pickup level | 9 |
Fixed current level | 9 |
3.5. Feeder protection
The utilities’ responses to the question regarding the typical relaying applied to their feeders are shown in Fig.5. While one respondent indicated that they are using circuit reclosers just in overhead lines, in another response it was stated circuit reclosers, phase overcurrent relays, and ground overcurrent relays are being used in rural, and urban sites, respectively. Distance relaying (in 33kV), negative sequence relaying (in 33kV), phase overcurrent relays (in 11&33kV), and ground overcurrent relays (in 11&33kV) are the practices by one of the other utilities. One respondent added that they are using frequency deviation trip relay in some feeders and the automatic tie control schemes are planned for future.
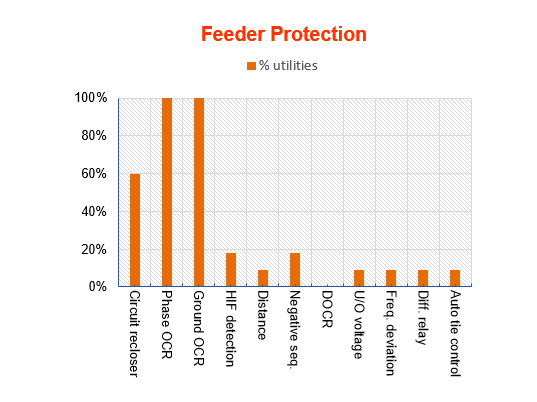
Figure 5 - Summary of the feeder protection practices in NZ distribution utilities
The respondents apply phase overcurrent protective devices with instantaneous trips for the purposes shown in Table IV.
| Criterion | % |
|---|---|
Fuse saving | 27 |
Limit duration of fault for personnel safety | 63 |
Limit equipment damage | 72 |
Minimize voltage dip duration | 63 |
Limit outage time | 81 |
Enhance coordination | 81 |
Enable grading margins | 72 |
81% of respondents reported it is necessary to use distance relays on distribution circuits. One utility is using it only in the 66 kV sub-transmission network. The other respondent reported in 33 kV sub-transmission network and one respondent utility is using distance rely only in substations. Responses to all types of phase distance relays used are summarized in Table V. It should be noted that respondents may have checked more than one type.
| % | |
|---|---|
Phase distance only | 9 |
Phase and ground distance | 63 |
Single zone | 0 |
Multi zone | 72 |
When asked what type of backup protection is provided for failure of a microprocessor-based distribution relay more than 90% of the respondents indicated that they use normal upstream device relays -that is, relays located closer to the substation that can trip and isolate a larger section of the network if the local relay fails.
Overall, the answers to this question implied that while some new technologies and functionalities have been introduced to the distribution protection, overcurrent relays and reclosers are the most used options for feeder protection. All responded utilities do attempt to achieve complete coordination of feeder phase time overcurrent protective devices. The criteria used to determine phase overcurrent pick-up is shown in Table VI.
| Criterion | % |
|---|---|
A multiple of expected feeder load | 63 |
Conductor thermal limits | 72 |
Emergency loading | 63 |
Coordination considerations with downstream devices | 81 |
Coordination considerations with upstream devices | 81 |
Available tail end fault current | 72 |
When asked whether they used ground current protection along with over-current protection device all respondents replied they did. One respondent utility report that earth-fault protection is typically used in conjunction with over current for overhead feeders. However, for purely underground feeders, separate earth fault protection is not generally used because earth faults in underground cables usually produce a large current, which can be detected by overcurrent protection or cable differential protection. Differential protection can quickly detect and isolate faults by comparing the current entering and leaving the cable. Therefore, earth faults in underground feeders are effectively cleared without needing a dedicated earth fault relay. Utilities indicated the criteria in Table VII were used to establish pickup settings.
| Criterion | % |
|---|---|
| Percent of feeder maximum capacity | 27 |
| Percent of feeder expected maximum load | 9 |
| Percent of phase device pickup level | 18 |
| Fixed current level | 0 |
| Based on maximum downstream fuse size | 18 |
| Available tail end fault current | 27 |
Inverse time and definite time delays are the major feeder time-over current characteristics used by the utilities.
All respondents attempt to achieve complete coordination of ground time overcurrent protective devices. One respondent utility indicated that this is achieved by applying ground settings on downstream reclosers.
3.6. Maximum Fault Current
When asked to report on whether they set maximum design limits for fault current levels on their system or not, ten out of eleven respondents replied that they did set limits. In one case, it was stated that they have this setting mostly in weak systems.
When asked to report on the methods used to limit fault current on their system, the following responses were received (Fig. 6).
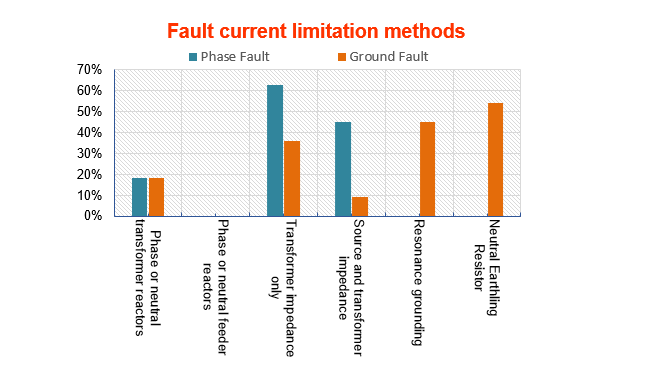
Figure 6 - Fault current limitation methods
4. Reclosing
All respondents reported applying automatic reclosing to feeder interrupting device on overhead distribution circuits. When asked how many re-closing attempts are configured responses in Fig. 7 were received. One respondent has indicated that they use this device just in rural sites.
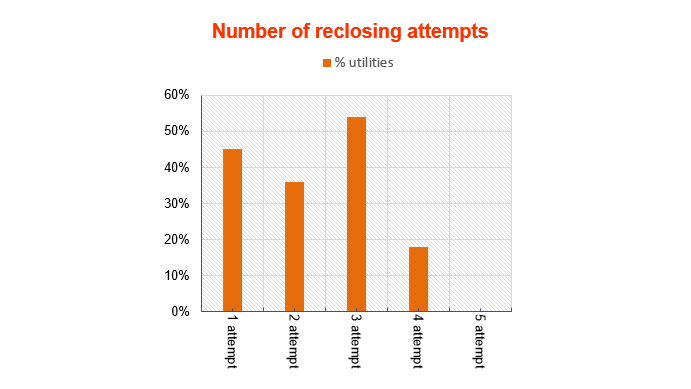
Figure 7 - Number of reclosing attempts by the respondent utilities
In majority of the respondent utilities (> 90%) the first reclosing time is less than 5 sec. Among the users employing more than one reclosing attempt, all used a time delay less than 15 seconds. Ten out of eleven respondents answered that, adaptive reclosing is not in effect on their feeders.
Eight out of eleven (73%) respondent utilities are using reclosing on feeders with 25 up to 50% underground cables and for the rest 27% there is no automatic reclosing on feeders with underground cables. One respondent has explained that feeders predominantly cable are not automatically reclosed.
One respondent indicated that they use adaptive reclosing off only for earth fault as they don’t want PQ events. When asked what the reset time for reclosure is, the answers were split evenly between different options ranging from less than 5 sec to more than 60 sec. Integral reclosing within the overcurrent relay is used by all respondent utilities as the reclosing hardware. Programmable logic controller is the other reclosing hardware that is dedicated to one feeder (18%) and/or multiple feeders (27%) by the utilities.

5. System faults
More than 90% (10 out of the 11) of the respondents keep statistics on the number of outages on the distribution system, which is almost universal. 91% of respondents do not have a program in place to report a high impedance ground fault. One utility is planning.
5.1. Breaker failure
When asked if they have experienced breaker failure in last two years for the places specified in the table the answers were as following (Table VIII).
| Places | % |
|---|---|
Distribution feeders | 9 |
Selected breakers, due to criticality | 9 |
New distribution breaker installations | 9 |
Metal clad switchgear breakers | 18 |
One of the two respondents that chose the “metal clad switchgear breakers” option explained that they lost transformer due to plug/socket connection opening. One utility responded that they have experienced one beaker failure. One respondent commented that no circuit breaker has failed to operate on fault, occasional feeder has failed to operate due to a secondary systems issue such as wiring, tripping batteries, etc.
Among respondents using distribution breaker failure schemes, three utilities (50%) had experienced proper trips, 2 utilities (33%) had experiences false trips, and one utility (17%) reported fail to trip situations. One respondent reported that the incident occurred during commissioning.
5.2. Conductor Burndowns
Nine out of eleven utility respondents have experienced conductor burndowns, rarely (8), or occasionally (1). One respondent reported that conductor failure occurred due to weak joint or previous damage. The utility that reported occasional occurrences indicated that conductor burndowns are primarily caused by burned connections, with aged parallel groove being the most problematic, followed by line taps. One of those two utilities that haven’t experienced conductor burndowns explains that they may be unaware of occurrences due to the poor reporting.
5.3. Fault Clearing Time
Seven out of the eleven (63%) respondents have a less than 1 sec defined protective device clearing time criteria for distribution line protection. Two respondents indicated that it depends on fault type and fault current, and one reports that the maximum clearing time for earth fault is usually 1.5 seconds and 1 second for Phase faults. Another utility explains that it depends on equipment capability. In one utility the earth faults are given 0.5 second delay to allow transient faults onto the overhead lines, otherwise there will be fast trip or discrimination with downstream devices.
When asked what are the tripping criteria used for distribution line protection the answers were as shown in Fig. 8. Note that respondents may have checked more than one of the criteria.
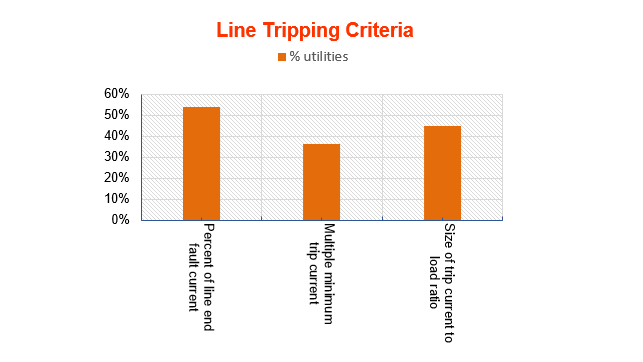
Figure 8 - Distribution line tripping criteria
While one respondent states that it depends on the control rating, and the other utility reports that the general criterion is 50% of line end fault current.
6. Single Wire Earth Return (SWER) protection
Single wire earth return was developed in New Zealand around 1925 for rural electrification. SWER has effectively been used in NZ, Australia, Canada, India, Brazil, Africa and Asia for lightly populated areas. It uses only one conductor with the return path through earth. 63% of the survey respondent utilities have rural SWER system from 230 V up to 19.1 kV voltages. 11 kV is the most common voltage for SWER in NZ.
When asked about the protection devices used at each voltage levels, the responses in Fig.9. were obtained.
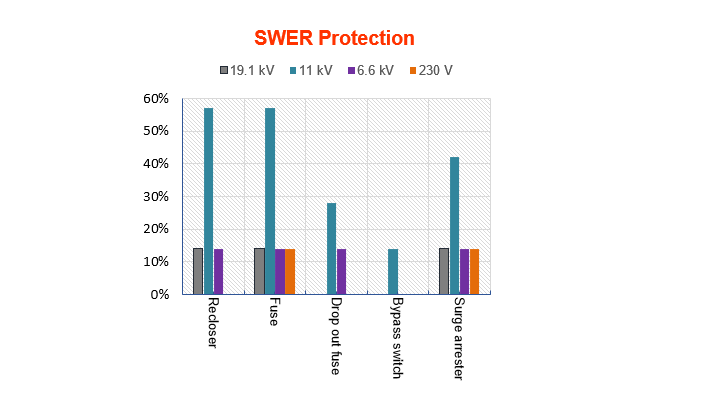
Figure 9 - Summary of the SWER protection practices in NZ distribution utilities
7. DRG Protection
90% of the respondents indicated that they have DRG connected to their distribution feeders. When asked about the standard relay specification factors for DRGs, the responses summarized in Table IX were received.
| % | |
|---|---|
Generator size | 72 |
Interconnection type | 45 |
Voltage level | 45 |
Existing line protection | 36 |
Loading on the DRG line | 45 |
When asked about the effects of DRGs on their usual protection practices, the responses were as shown in Table X. Note that respondents may have checked more than one impact.
| % | |
|---|---|
Revised substation reclosing practices | 63 |
Added transfer trip capabilities | 36 |
Revised coordination of feeder relaying | 27 |
Added voltage relays | 18 |
Added directional ground over-current relays | 9 |
Added directional phase over-current relays | 9 |
Added supervisory control to the feeder | 27 |
No effect | 9 |
Revised substation manual switching procedures | 18 |
Revised settings of existing phase relays | 36 |
The responses show that integration DRG has brought a significant changes inprotection scheme across NZ. The most common modification, reported by 63 % of respondents, was the revision of substation reclosing practices to extend first-shot reclose times or to eliminate reclosing to prevent unnecessary trips and allow DRG to stabilize [8]. Other adjustments included the addition of transfer trip capabilities (36 %), which isolates faulted sections quickly to prevent backfeeding from DG, protecting personnel and equipment [8]-[9] and the revision of existing phase relay settings (36 %) help to maintain selectivity and coordination with DRG [8]-[9]. Directional protection elements, both for ground and phase faults, were adopted by 9 % of respondents to address bidirectional power flows introduced by DRG [8]-[9]. Voltage relays were added by (18 %) of utilities to detect abnormal voltage condition due to DRG injection and trigger protection action [8]. Enhanced supervisory control (27 %) provides remote monitoring and control to manage DRG impacts and improve restoration times [8]-[10], and revised manual switching procedures (18 %) were introduced to improve operational flexibility and safety [8]-[10]. A minority of respondents (9 %) reported no effect on their protection practices, reflecting either low DRG penetration or existing system resilience. For domestic embedded generation, no effect on protection practice has been reported yet.
8. Protection System Operation
Four utilities have experienced over-voltage due to the neutral shift. One of the six respondents who have not experienced over-voltages assuming the question includes high voltage systems explains that overvoltage due to neutral shift is not a problem in the three wire systems used in NZ since loads are connected phase to phase. Multi-ground systems are only used at transmission voltages or at 230/400 volts.
Six respondents (54%) reported sympathetic trips of breakers on un-faulted feeders that were supplied from the same bus as a faulted feeder. Three respondents reported no sympathetic trips and two respondents indicated that they did not know. For respondents who reported experiencing sympathetic trips, all relevant relays that contributed to these trips are shown in Figure 10.
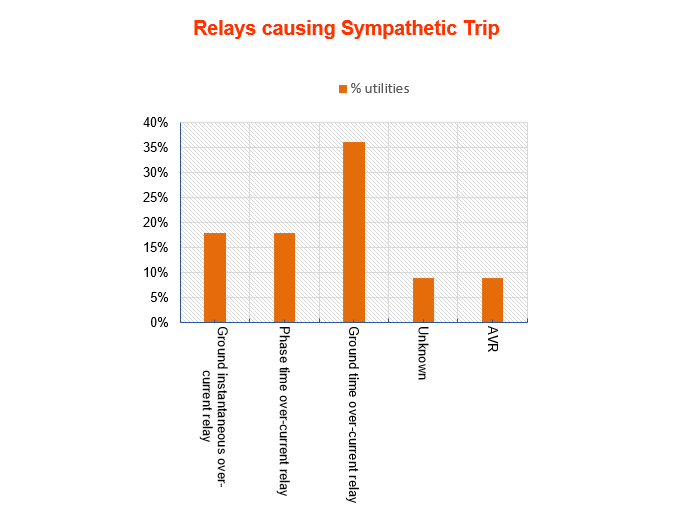
Figure 10 - Relays causing sympathetic tripping in the respondent utilities’ networks
0.2-0.6 sec is the most common time frame used by the respondent utilities as the coordination margin between bus and feeder relays. Survey recipients were also asked to indicate the minimum coordination time margin between their feeder protective device time current curve and a downstream fuse total clearing time. The answers for the different types of the feeder protective device are summarized in Fig.11.
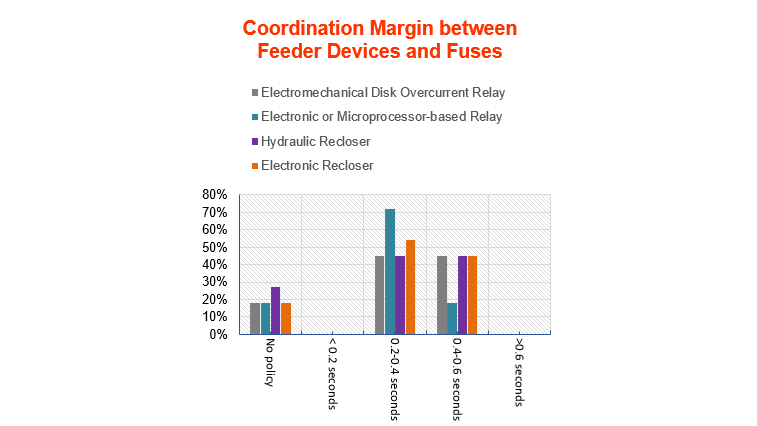
Figure 11 - Coordination margins between feeder devices and fuses used by NZ distribution utilities
9. Substation automation and protection practices
All respondents indicated that they are communicating with relays remotely. One indicated that they are slowly getting there; another utility is using the communication only for indication and control. One respondent reported that presently they are communicating with about 40% of their relays.
45% of respondents are using distribution relay fault location to help determine how far out on a feeder a fault has occurred with satisfactory results. One respondent is using this capability with unsatisfactory results and 4 respondents are planning in future. One respondent is not using this capability.
It was asked if their company applies some sort of substation automation or substation communication integration that incorporates distribution protection, the responses in Fig. 12 were received.
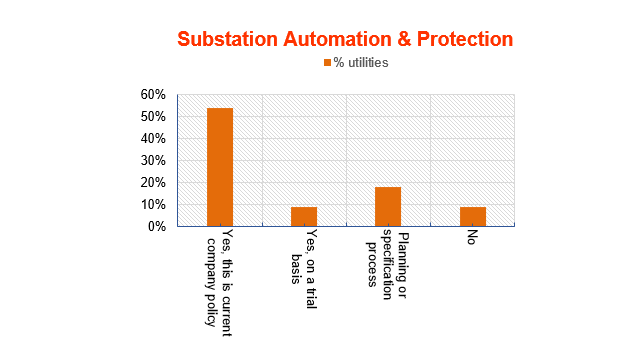
Figure 12 - Substation automation integration to protection by the respondent utilities
It was indicated that 72% of the respondent utilities have IEC 61850 compatible relays/devices installed. One utility has indicated that they are using IEC61850 only for parallel control of tap changers and not for protection. Main transformer station, switching station, and transforming station are the places where these IEC 61850 relays/ devices are installed.
Asked whether their company is in the process of retrofit or upgrade of distribution protection to install microprocessor- based protection, control, data and monitoring packages, nine utilities (81%) answered yes, and two (18%) replied they are planning or using specification process. One respondent stated that typically modern devices are installed on switchboard panels when switchboards are replaced at the end-of-life. Note that respondents may have checked more than one place.
10. Conclusions
The major findings of a survey of utility practices for the protection of New Zealand distribution networks are summarized in this paper. The extent of the customers’ coverage by the eleven respondents makes it reasonable to use the findings of the survey as a good representative for the NZ distribution network protection practices. The survey provides an overview of current technologies, operational practices, and future plans including details of protection assets and their specifications across different parts of the networks. Distribution utilities across the country can use these results as a bench mark to identify gaps, and prioritise upgrades, training to personnel, or investment in underutilised technologies.
A periodical survey of this kind will make it possible to identify the trends followed by the NZ distribution industry and to assess the strength and weakness of the entire distribution protection practices in the country. More over, the survey supports knowledge sharing, encourages collaboration on best practices, and provides evidence to justify future investments. By making use of findings utilities can improve their network reliability, efficiency, and resilience. Adding the current NZ ICT practices followed by the distribution utilities [7] to this report and comparing it to the requirements of an active distribution network protection makes it possible to assess the opportunities and the shortcomings in the journey towards a smart distribution system. Such detailed surveys may also be used by the engineering professionals in the other countries to run similar surveys for their distribution networks.
Acknowledgement
The author would like to acknowledge the New Zealand Ministry of Business, Innovation and Employment (MBIE) “Renewable Energy and Smart Grid” 6-year research and development project completed in 2018. Frank Arthur (Alpine Energy), Aaron Aarooran (Aurora Energy), Alisdair Reid (Main Power), Sujay Orpe (North power), Stephen Hirsch (Orion), Glenn Coates (Orion), Stephen Chiu (PowerCo), Dyson Gentle (PowerNet), Leon Viljoen (Unison Networks), Zhelyko Popovich (Vector), Chamila Herath (Wellington Electricity), Nenad Pulijic (WEL Network) are the industry contributors to this survey report.
The author would also like to thank Momen Bahadornejad and Mehdi Farzinfar for their data-collection and technical support. Updates to this project is being undertaken through ongoing MBIE Strategic Science and Innovation Fund (SSIF) for Advanced Energy Technology Platform program “Architecture of the Future Low Carbon, Resilient, Electrical Power System” contract number UOCX2007 (2020-27) focusing on mixed AC/DC networks.
References
- Distribution Line Protection Practices Industry Survey Analysis," Power Apparatus and Systems, IEEE Transactions on , vol.PAS-102, no.10, pp.3279,3287, Oct. 1983
- Distribution Line Protection Practices Industry Survey Analysis IEEE Power System Relaying Committee," Power Engineering Review, IEEE , vol.PER-3, no.10, pp.27,27, Oct. 1983
- Strang, W.M.; Westfall, R.M.; Darlington, A.N.; Drum, P.R.; Fulton, D.; Guro, E.; Huddleston, J.D., III; Kaschalk, T.L.; Latham, J.R.; Marsh, W.J.; McDonald, M.J.; Moran, R.J.; Pettigrew, R.D.; Taylor, R.P.; Tengdin, J.T., "Distribution line protection practices industry survey results," Transmission and Distribution Conference, 1994., Proceedings of the 1994 IEEE Power Engineering Society , vol., no., pp.291,301, 10-15 Apr 1994
- Strang, W.M.; Westfall, R.M.; Darlington, AN.; Drum, P.R.; Fulton, D.; Guro, E.; Huddleston, J.D., III; Kaschalk, T.L.; Latham, J.R.; Marsh, W.J.; McDonald, M.J.; Moran, R.J.; Pettigrew, R.D.; Taylor, R.P.; Tengdin, J.T., "Distribution line protection practices industry survey results," Power Delivery, IEEE Transactions on , vol.10, no.1, pp.176,186, Jan 1995
- P.T. Carroll, C. Fink, J. Appleyard, J. R. Boyle, B. Jackson, J. Johnson, L. Kojovic, E. Krizauskas, L. P. Lawhead, P. J. Lerley, D. Miller, A. Napikoski, R.D. Pettigrew, W. M. Strang, C. R. Sufana, R.P. Taylor, J. T. Tengdin, J. T. Uchiyama, R. M. Westfall, J. B. Williams, P. Winston, J. A. Zipp, “Distribution line protection practices industry survey results”, IEEE power system relaying committee (Working Group on Distribution Protection) report, December 2002
- Mehdi Farzinfar, Momen Bahadornejad, Ankur Mishra, Nirmal Nair, et.al "Impacts of DRGs on distribution network protection", 2014. Available online
- Nair, N, Joish, J., and Bahadornejad, M.," Smart Grid ICT infrastructure: New Zealand perspective Electricity Engineer’s Association NZ Annual Conference 2015 Available online
Biography
Nirmal-Kumar C. Nair received his BE, M.S. University, ME High Voltage from Indian Institute of Science, PhD Texas A&M University. He has professional experiences in India, USA and New Zealand. He currently leads Power Systems Group of Department of Electrical, Computer, and Software Engineering at University of Auckland, New Zealand. University of Auckland is a CIGRE collective-II founding member since 2006 when CIGRE New Zealand National Committee (CIGRE NZNC) was formed. Currently, CIGRE NZNC is very active and has very active engagement across 10 Study Committees (A2, A3, B1-B5, C5, C6, D1 and D2). Nirmal is currently CIGRE NZNC Technical Chair. He has been serving as an Executive of CIGRE New Zealand National Committee since 2008, and CIGRE B5, as a technical advisor for New Network Requirements, He co-edited CIGRE Green Book “IEC 61850 Principles and Applications to Electric Power Systems” and involved with several B5 Technical Brochures. He has hosted several international power system conferences in Auckland, New Zealand over the years. He has been recognized as an IEEE Fellow and CIGRE Distinguished Member.