A2 - On-site GIC withstand experiment on a 1000 MVA 3-limb autotransformer and a 300 MVA 5-limb transformer
Authors
Roald KLEIVI, Trond-Magne OHNSTAD, Geir-Morten BJØRGVIK†, Dejan SUSA - Statnett, Norway
Dietrich BONMANN - Hitachi Energy, Germany
Claes CARRANDER - Hitachi Energy, Sweden

Summary
This research work represents a unique approach to evaluate and verify the extent of geomagnetic induced currents (GIC) effect on power transformers considering two critical core designs and tertiary winding influence. Due to the amount of the work, this paper will be followed by the companion paper, " Part 2: Measurements and evaluation", submitted by German NC, which will discuss in detail results of the site measurements including comparison to the factory modelling tools.
Part 1 describes the necessary characteristic of transformer designs, corresponding modelling that results in predetermined sensor locations, installed instrumentation, data acquisition system, factory and site testing setups and safety conditions as well as determination of testing sequences as briefly discussed further in the text.
Power transformers can be exposed to the Geomagnetically Induced Currents (GIC) as well as to DC from other sources (e.g. DC driven railways, Monopolar operation of HVDC lines, DC injection by power electronics, AC-DC hybrid lines). The consequences can range from elevated noise and vibration levels to the heating of windings and structural metallic components. Additionally, there may be an increase in the transformer's reactive power consumption, as well as in the gas generation, and the injection of high levels of harmonic currents into the power system. These factors could potentially result in power outages and a shortened lifetime for power transformers.
To assess the extent of these consequences a GIC joint research project was established by Statnett and Hitachi Energy. As part of the project two transmission 420 kV power transformers were designed, manufactured, factory tested and comprehensively instrumented to study the geomagnetic current effect on power transformers at the substation under DC current injection.
The transformers’ fundamental data are:
- T4: 300/300/0,5/100MVA, 420/107.5(138)/0.54/22 kV, ONAN/ONAF, YNyn0(yn0)yn0+d, 5 limb core, 3 phase unit
- T2: 1000/1000/0.5/100 MVA, 420/300/1/24 kV, ONAN/ONAF, YNa0yn0+d, 3 limb core, 3 phase unit
The transformers were equipped with data acquisition systems incorporating thermocouple sensors measuring temperatures in and around the cores and structural parts, fiberoptic sensors measuring temperatures in the windings, search coils measuring the magnetic fluxes in the tie plates; and Hall-effect current transformers (CT) measuring the currents in the delta windings and in the transformer neutrals. The applied currents and voltages during the tests were measured using the station current and voltage transformers during the experiment and using the test room equipment during the factory acceptance test (FAT).
The function of all sensors and of the data acquisition system before shipping were tested during extended both temperature rise and overexcitation tests.
During the site test, both transformers were connected to the same 420 kV busbar with their HV terminals. The HV neutrals were isolated from ground by opening grounding switches after the transformers were energized and the inrush had decayed. The DC current was injected between the neutral terminals and ramped up in steps from 0 to 5 A, 10 A, 25 A, 50 A….up to 200 A, held constant for 20 to 35 minutes at each level.
Keywords
Geomagnetic Induced Currents (GIC), Site testing, Windings, Structural parts, temperatures, 5 limb unit, 3 limb unit1. Introduction
Geomagnetically Induced Currents (GICs) represent a phenomenon that can have profound effects on power transformers, introducing challenges and potential risks to the stability and functionality of these critical components and the power grid. Therefore, this research work was undertaken with the overarching objective of not only clarifying the extent of the observed effects but also allocating and identifying potential risks associated with the parameters under investigation as reported in the companion papers Part 1 and Part 2, [1].
This paper is organized into a few distinct sections, with Section 2 focusing on the fundamental design parameters of power transformers and sensor placement. Section 3 details the data acquisition system, while Section 4 reports the outcomes of factory tests, verifying the functionality of sensors, data acquisition, and transformer design. In Section 5, simulation results are presented, assessing the impact of GIC on power transformers and offering essential information for network operators. This includes details on reactive power consumption, potential harmonic distortions at the 420 kV side, and magnetic flux assessment. The simulations also aid in determining safety protocols for site testing procedures. Section 6 outlines the site testing setup and procedures. Finally, Section 7 concisely summarizes the conclusions drawn from the entire paper.
2. Fundamental Design Parameters of Power Transformers and Placement of Sensors
T4, 300 MVA 5-limb core transformer rated voltages were 420 ±12x1%/107.5(138)/0.54/22 kV. The windings seen from the limb side were as follows, 107 (138) kV and 420 kV main windings, the regulating winding, and the 22-kV tertiary winding. The connection was YNyn0(yn0)yno+d, and the short circuit impedance in the 300/300 MVA main direction was 14.8%.
The rated voltages of the 1000 MVA 3-limb core auto transformer, T2, were 420 /300/1/22 kV. The windings seen from the limb side were as follows, common and series main windings, and the 22-kV tertiary winding. The connection was YNa0yn0+d, and the short circuit impedance in the 1000/1000 MVA main direction was 5.8%.
The oil flow through the windings was guided by oil guiding rings in a zigzag pattern.
Both units were fitted with multiple sensors placed at locations determined through modelling and well-established research findings, [2], [3], [4], as outlined below:
A. Windings Fibre Optical Temperature Sensors
As part of the standard delivery 10 fibre optical sensors were installed in phase B 420 kV and 107.5 kV windings, and additional 26 fibre optical sensors as part of GIC monitoring system were installed in all windings of the central limb, phase B and outer limb phase C, and in the magnetic winding supports, Figure 1. The magnetic winding supports are arranged below and above the windings to collect the stray flux from the windings and guide it to the yoke laminations in a controlled way.
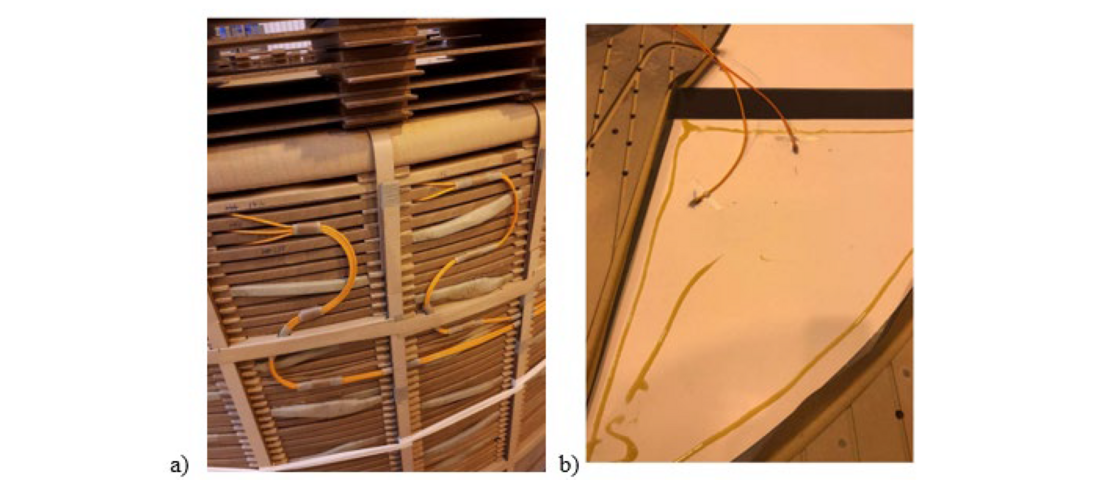
Figure 1 - a) FO sensors in winding; b) FO sensors in the magnetic winding supports on the side facing the windings
B. Core, Clamps, Tie Plates Thermocouples
35 and 31 thermocouples (TCs) were installed in the T4 300 MVA and T2 1000 MVA units respectively at the top, middle and bottom of the tie plates next to the limbs of phases B and C and of one side limb, in the cooling ducts between the tie plates, at the edges of the outer core packages, on the edges of the upper and lower yoke clamps near the tie plates, in the top yoke and in the bulk oil near the bottom yoke, Figure 2 and Figure 3.
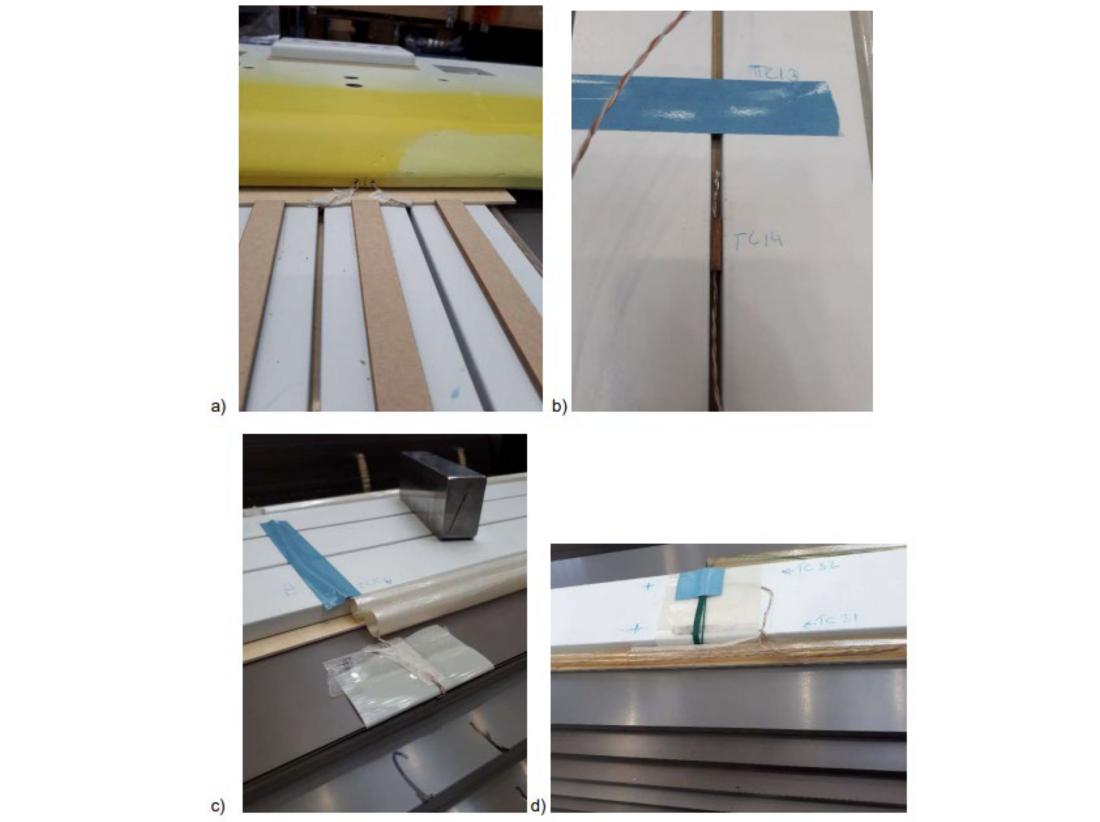
Figure 2 - Placement of thermocouples in a) yoke clamps, b) tie plates and tie plate ducts, c) outer core package outer sheets, d) tie plate of side limb
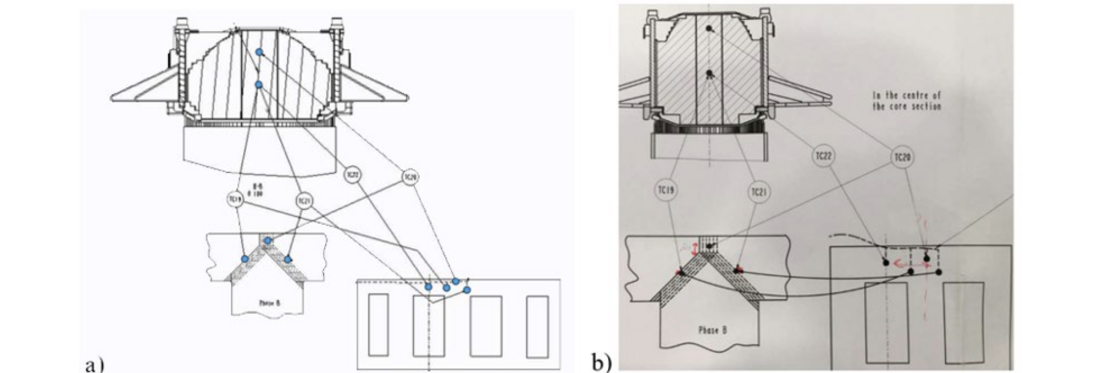
Figure 3 - Location of TCs in the center package of the top yoke considering cross-view a) 5 limb-blue dots, and b) 3 limb-black dots
C. Tie plate Flux Coils
Six search coils with 4 (5) turns of copper wire were wound around the three tie plates per main limb at half height and near the bottom winding ends of phases B and C, and around the single tie plate of one side limb in T4 300 MVA (T2 1000 MVA), Figure 4.
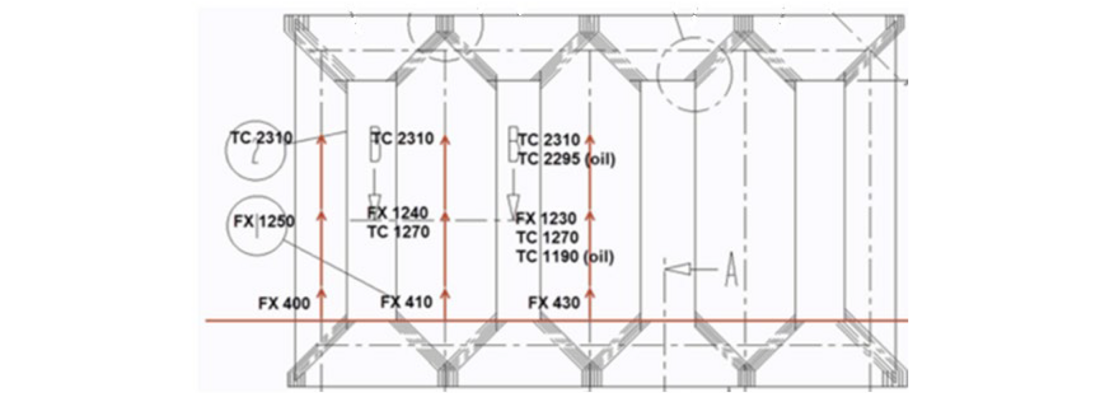
Figure 4 - Location of the search coils (FX) around the tie plates and the location of thermocouples (TC) in the tie plates and the cooling ducts between the tie plates
D.
Special CTs based on Hall sensors capable of measuring both AC and DC were installed on the busbar between bushing terminals closing the delta connection of the tertiary winding and on the conductor leading to the neutral grounding.
E.
Currents and voltages at the 420 kV and 300 kV terminals are measured using ordinary AC CTs and VTs
3. Data Acquisition System
To collect data, a dedicated data acquisition system, as illustrated in Figure 5, was constructed. The millivolt (mV) signals from the thermocouples (TCs) are converted to standard 4…20 mA signals through conventional measuring transducers. These analog signals are then digitized and temporarily stored in a Remote Terminal Unit (RTU) capable of IEC 61850 communication. The RTU is linked to an active Ethernet switch located in the control cabinet. Optical fibers are connected to Qualitrol 408 XT sensing units, where the signals are digitized and logged. These Qualitrol sensing units share the same Ethernet switch as the RTU.
Transient recordings from flux coils and special Current Transformers (CTs), featuring signals ranging from mV to a few Volts, are transmitted via twisted pairs to the +/- 16 V inputs of A/D converters derived from the HVDC Mach3 portfolio (3 x PS741 with 3 channels each). The PS741 A/D converters are interconnected via Ethernet within the control cabinet and then transmitted to the PS700 process computer through optical fibers. The transient recordings are temporarily stored in the PS700, allowing retrieval through Ethernet protocols or IEC 61850 in the future.
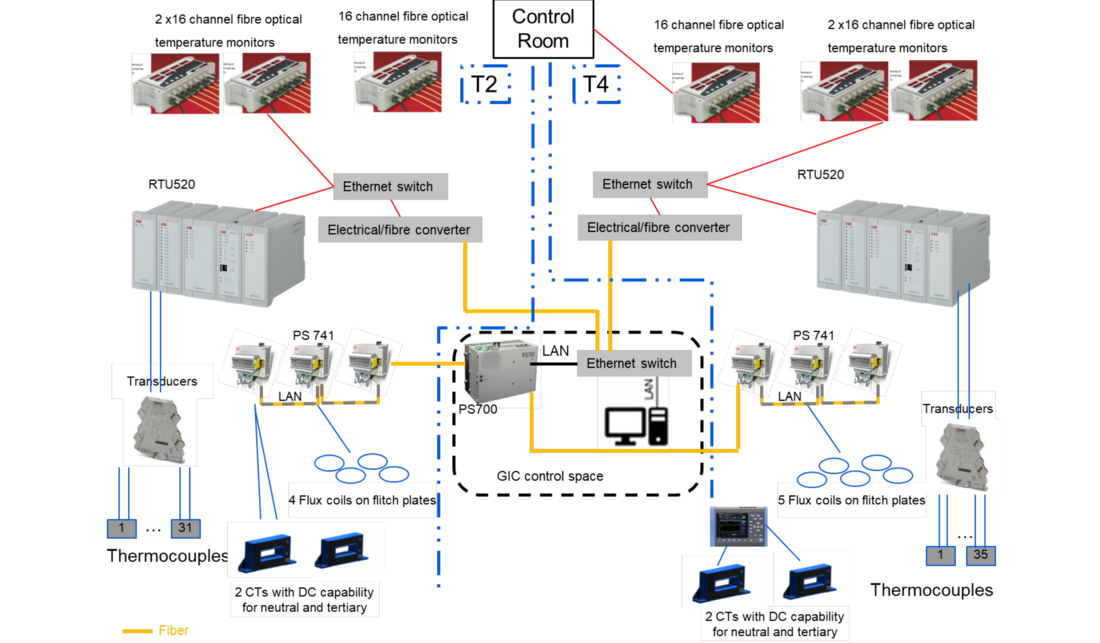
Figure 5 - GIC Data Acquisition System (flow of signals)
4. Factory testing
The functionality of all sensors and the data acquisition system underwent thorough testing, including extended temperature rise and overexcitation tests before shipment. These tests, combined with the standard factory acceptance assessment, allowed for a detailed design review, and established a reference baseline under standard conditions, given the unavailability of DC current supply at the factory.
As part of testing the T4 300 MVA 5 limb power transformer and taking advantage of the several sensors, extended temperature rise tests under load current and at no-load were performed. The function of all sensors and of the data acquisition system was verified, and some improvements like surge protection of the thermocouple transducer inputs and optimized settings of the transient recorders were implemented. Local loss densities in tie plates, yoke clamps and laminated winding supports were determined from the measurements under short-circuited conditions and from recorded corresponding temperatures, Figure 6.
The heat transfer coefficient in vertical ducts is a non-linear function increasing typically with a power in the range of 0.2 to 0.33 with heat flux density (W/m2). For the heat flux densities encountered under nominal conditions 100 W/m2/K is a common assumption. This value could be confirmed for the tie plate cooling ducts. Heat transfer coefficients at the edges of the core clamps appear to be more complex than the commonly made assumptions of heat transfer from vertical and horizontal surfaces.
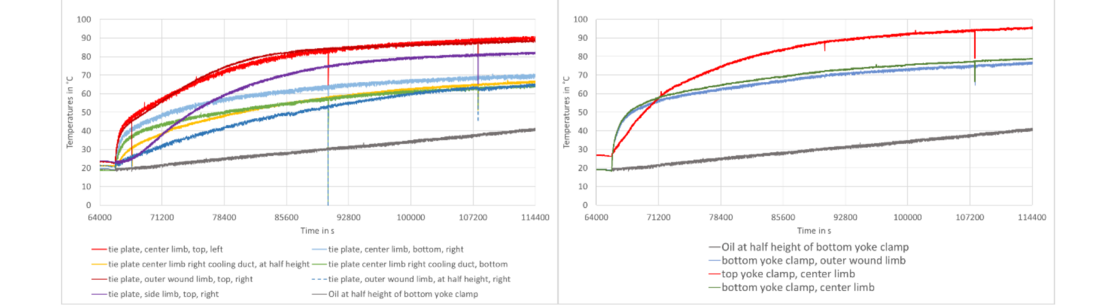
Figure 6 - Temperature in °C vs time in seconds for the tie plates (left) and at the edges of the yoke clamps (right) over time at 130% of rated current, 300 MVA transformers
At no-load, the local loss densities could not be determined due to very small absolute temperature rises and not well-defined starting conditions due to a preceding additional load test. However, the flux densities in core and tie plates during overexcitation were determined. The measured flux in the tie plates was understood assuming an eddy current model (Cauer model in a circuit simulation, [5]).
Similarly, as part of the 130% load test of the T2 1000 MVA 3 limb power transformer the local loss densities in magnetic winding supports, core clamps and tie plates were determined when subjected to stray flux from the windings block. The axial stray flux captured by the tie plates was also determined.
Moreover, as part of the over-excitation test, the waveshapes of magnetic flux in the tie plates could be determined at 100% and 120% of rated voltage. The flux did not vary significantly along the length of the windings. When the core approached saturation the tie plates rapidly picked up significant flux and the waveshapes changed significantly. Approximate “B-H-curves” of tie plates and core limbs could be derived from the measurements of excitation current and induced voltages, especially if one corrected for capacitive currents.
Finaly, the following lines provide valuable feedback from the instrumentation and sensor functionality assessment:
- Calibration of unconventional CTs needed to be confirmed.
- Signals from the unconventional CTs needed to be shielded.
- All transients needed to be recorded with a sampling rate of at least 10 kHz.
- Duration of samples of 200 ms should be sufficient but 2000 ms should allow a sharper Fourier transform of the signal for further processing.
- The clocks of PS700/741 and of the transient recorder (Scada) for the conventional CTs and VTs needed to be synchronized and/or common trigger settings like pre-trigger and post trigger times, sampling rates…should be used.
- All sensors capable of measuring DC voltages or currents are subject to zero drift. This can be compensated for during post-processing of data from specific experiments. For on-line monitoring a method for handling this drift needed to be found.
- Thermocouple wires may pick up transient high voltages during impulse testing, even from components that are nominally grounded. Therefore, surge arresters needed to be applied at the signal converter inputs.
- Temperature logging with a sampling interval of 8 seconds for about 6.2 hours in the RTU and in the Qualitrol sensing units were found adequate for the on-site experiment.
5. Simulating the Impact of Geomagnetically Induced Currents on Power Transformers
The magnetic circuits were modelled by equivalent electrical circuits using the duality of magnetic and electrical circuits. The equivalent electrical circuits of the magnetic circuits were coupled with external components using ideal transformers representing the actual turns ratio. The flux paths in the core and off-core were represented by non-linear and linear inductors. The values of these lumped elements were derived from the geometry. The flux paths in the core were dissected into wound and non-wound limbs, as well as the yokes between limbs. The lengths and cross sections of these components were readily available from the design files. The coaxial flux paths in the ducts between windings and between windings and the core were determined by their mean diameters and height. This is an approximation, it neglects the potential divergence of the magnetic field, which may not be parallel to the limb axis, depending on the degree of core saturation. Additional approximations, guided by 2D and 3D magnetic field plots, were necessary to ascertain values for sections of off-core flux paths in the radial direction at the winding ends. This was also essential for paths transferring flux from the saturating core yokes and return limbs to the tank. The simulations were performed using a commercially available circuit simulating software based on SPICE.
Circuit simulations were conducted to assess the anticipated reactive power consumption and potential harmonic distortion in the 420 kV voltage. This analysis aimed to secure approval from the network operator for the upcoming test. Furthermore, calculations were performed to determine the magnetic flux in the tie plates adjacent to the core limbs, establishing the range for induced voltages in the flux search coils. The simulated current waveforms in all windings helped in specifying the parameters for the Hall sensor Current Transformers (CTs).
5.1. Findings from the simulated scenarios
Circuit simulations were performed first for the individual transformers connected with all three phases to the 420 kV busbar, at no-load, and DC circulation between the neutrals of the HV windings and the phase voltage sources.
Reactive power as product of the fundamentals of voltage and magnetizing current was calculated to 20 MVAr for the 3-limb transformer and 49 MVAr for the 5-limb transformer at 200 A DC through the neutrals.
For the 5-limb unit T4 saturation starts at < 10 A DC. For the unwound side limbs and side yokes the flux density does no longer have zero transitions due to the DC bias, Figure 7. For higher DC currents the unwound side limbs are saturated for most of the cycle with very moderate amplitudes, while for the main yokes the flux density varies between positive and negative saturation, Figure 8.
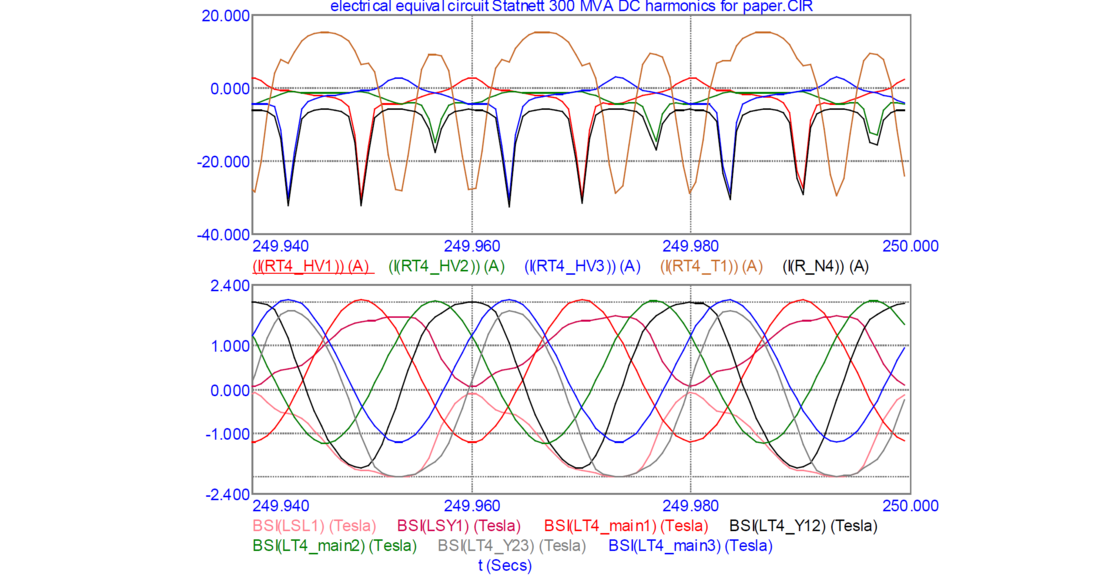
Figure 7 - Currents in transformer T4 300 MVA for 9.93 A DC in the neutral. Excited windings HV1, HV2, HV3 (red, green blue), delta-connected tertiary winding (brown), and neutral current (black). Flux densities in the core regions main limbs, main yokes (Y12, Y23), side limbs (LSL), and side yokes (LSY)
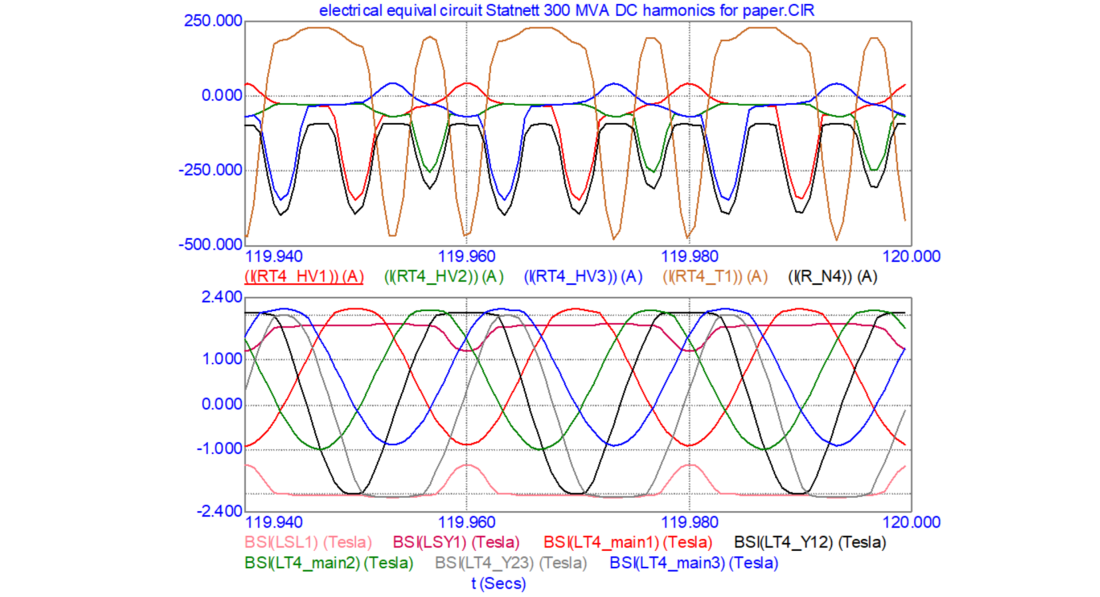
Figure 8 - Currents in transformer T4 300 MVA for 200 A DC in the neutral. Excited windings HV1, HV2, HV3 (red, green blue), delta-connected tertiary winding (brown), and neutral current (black). Flux densities in the core regions main limbs, main yokes (Y12, Y23), side limbs (LSL), and side yokes (LSY)
In the 3-limb design the onset of saturation effects is predicted between 50 and 200 A DC through its neutral, Figure 9 and Figure 10 respectively.
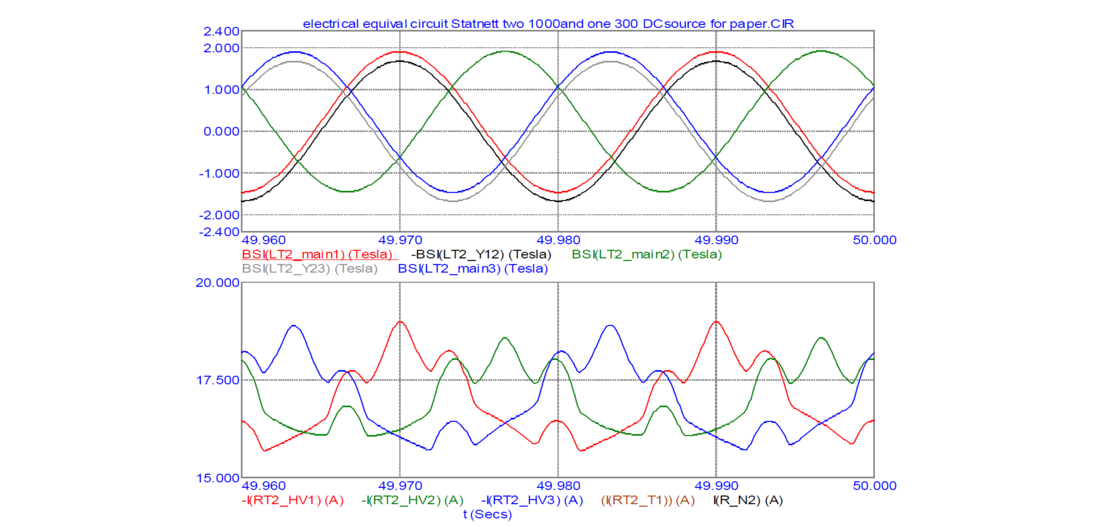
Figure 9 - Flux densities (top) and exciting currents (bottom) in the T2 1000 MVA 3-limb autotransformer with 50 A DC in the neutral. The flux density in the limbs is shifted but does not reach saturation. The excitation currents do not have zero transitions due to the DC bias
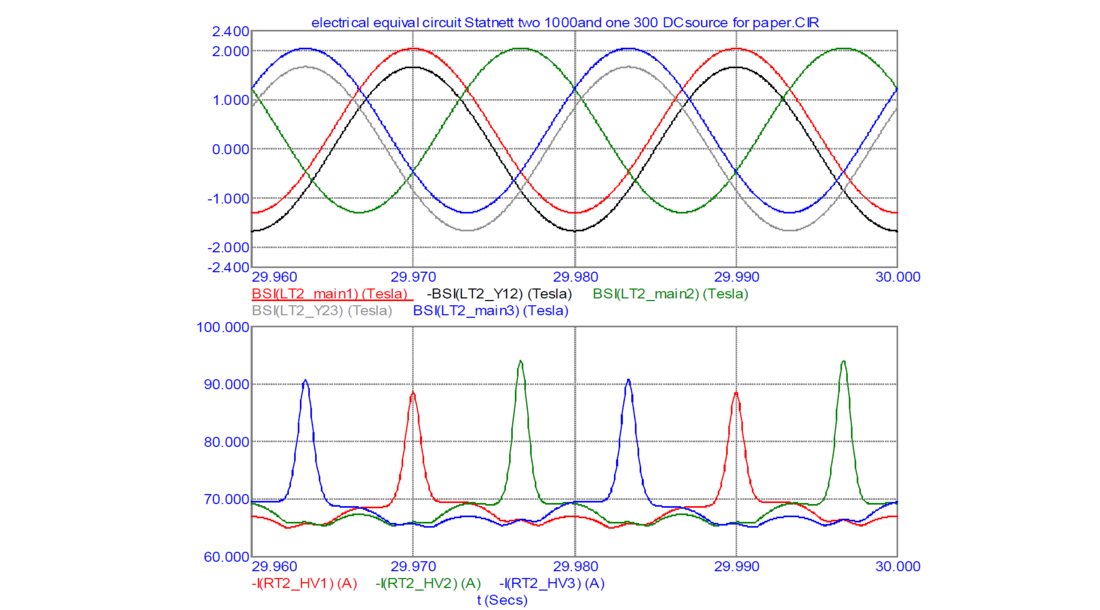
Figure 10 - Flux densities (top) and exciting currents (bottom) in the T2 1000 MVA 3-limb autotransformer with 200 A DC in the neutral. The excitation currents do not have zero transitions due to the DC bias
6. Geomagnetically Induced Current Testing Conducted at the Statnett Kvinesdal Substation
The test was performed at the Kvinesdal 420 / 300 / 138 kV substation in Norway. The two transformers, T2 1000 MVA and T4 300 MVA selected for the test are about 400 m apart from each other. Figure 11 illustrates the test connections.
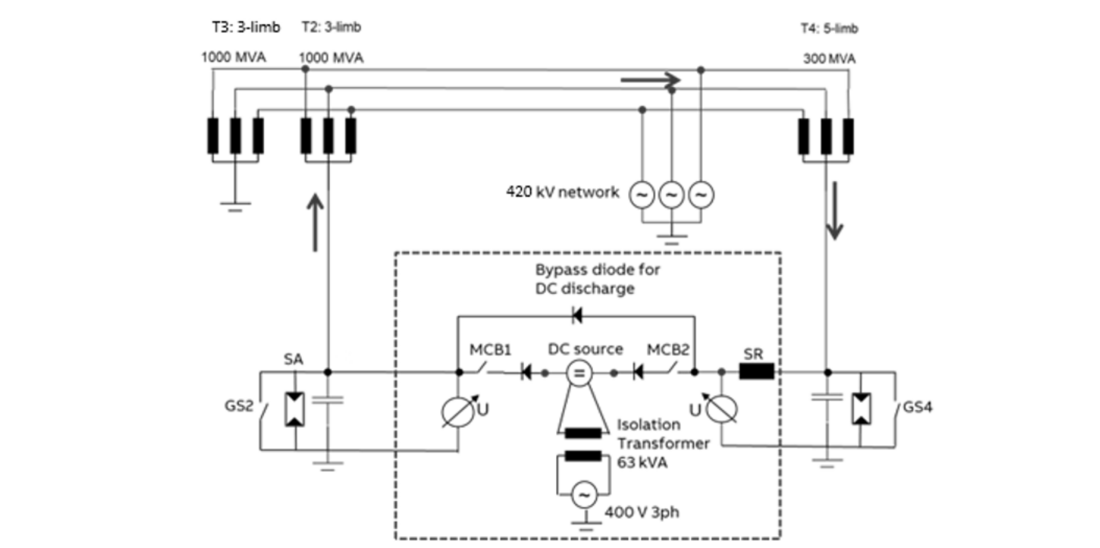
Figure 11 - Connections for feeding DC on site. Components inside the dashed box, except for the smoothing reactor (SR), were located inside the substation building, accessible to personnel. The other components were located next to the transformer bays. Transformers are illustrated only with corresponding HV windings
The neutrals of the transformers to be tested had to be galvanically separated from substation ground to exclude leakage of DC to any other transformers in the station, see Figure 11. The DC source was connected between the neutrals of the two transformers to drive current from neutral of T2 through the windings of T2 via the 420 kV busbar to T4 and back through the neutral of T4. This means that the DC source and connected measuring equipment were on floating potential. The equivalent circuit models for both transformers (and for a second 1000 MVA transformer for sympathetic inrush), together with lumped elements for capacitors, smoothing reactor, DC voltage source, and simple switches were used in circuit simulations to determine voltages to ground and across the DC source and the smoothing reactor under all conditions that might occur during the execution of the test. The simulations also helped to determine a safety procedure for the performance of the test as follows:
- Energization of transformers T4 and T2. They needed to be solidly grounded in order to avoid high voltages at the grounding capacitors or high energy absorption in the surge arresters to ground.
- Ungrounding of the transformers under test. One must wait for inrush to decay before opening the grounding switches GS2 and GS4.
- Energization, de-energization of nearby transformer T3 connected to the same 420 kV bus. There is sympathetic inrush. Voltages at neutrals of T2 and T4 are controlled by surge arresters. Energy absorption by the surge arresters to ground was determined.
- Fault on 420 kV system. Voltages to ground and across the DC source and smoothing reactor were controlled by the grounding capacitors to safe values.
- Injection of DC. The voltage should be ramped up and down slowly to avoid low frequency oscillations between transformer inductances and grounding capacitors.
- Maximum DC. The grounding capacitors need to conduct the harmonic currents not summing up to zero at the neutrals. The fraction of harmonics in the magnetizing currents passing through the DC source need to be limited by a smoothing reactor to match the specification of the power electronic DC source.
- Switching off DC or failure of DC source. A bypass diode across the DC source will allow the system to safely discharge the stored magnetic energy in case the source is interrupted and not ramped down slowly.
- As the final step, grounding and de-energizing of the transformers to be performed.
Additionally, the planning studies allowed to determine a practical insulation level of the DC source to its grounded housing and operator interface. Voltages and energy absorption for the surge arresters could be specified accordingly. Ratings for capacitors and smoothing reactor could be determined. The necessary breaking and making capabilities of miniature circuit breakers and grounding switches were found as well.
7. Conclusion
This paper, Part 1, details the on-site Geomagnetically Induced Current (GIC) withstand experiment setup conducted on both a 1000 MVA autotransformer and a 300 MVA 5-limb transformer. Also, including the necessary studies to dimension additional components and ensure the safety of the procedure. Comprehensive descriptions of the test objects and the deployed sensors are provided. The method and underlying assumptions for the circuit simulation are outlined, laying the groundwork for accurate predictions.
Simulated insights into the anticipated outcomes, such as reactive power, current waveshapes, flux densities, sound level increases are presented based on the simulation results. This comprehensive overview sets the stage for a thorough understanding of the expected impacts and performances under GIC conditions.
Moving on to the companion paper, Part 2, [1], the focus shifts to the presentation and comparison of the actual measurement results with the previously outlined predictions. This part of the report will serve to validate the accuracy of the simulation model and provide valuable insights into the real-time behaviour of the transformers under GIC-induced stresses. By comparing the measured data with the simulated expectations, a comprehensive assessment of the experiment's outcomes and the transformers' performance can be obtained.
Understanding the impact of GIC on power transformers is crucial for ensuring the resilience and reliability of the electrical infrastructure.
References
- D. Bonmann, C. Carrander, R. Kleivi, T. Ohnstad, G. Bjørgvik and D. Susa, "On-site GIC withstand experiment on a 1000 MVA autotransformer and a 300 MVA 5-limb transformer, Part 2: Measurments and Evaluation," in CIGRE Paris Session, Paris, 2024, ref A2-11033-2024.
- M. Lahtinen and J. Elovaara, "GIC Occurrences and GIC Test for 400 kV System Transformer," IEEE Transactions on Power Delivery, Vol. 17, No. 2, pp. 555-561, 2002.
- P. Picher, "Study of the acceptable dc current limit in core-form power, PhD Thesis," University of Montreal, Ecole Polytechnique De Montreal, Canada, Montreal, 1997.
- J. Raith, "Risk Assessment of Power Transformers under the Influence of Geomagnetically Induced," University of Graz, Austria, Graz, 2019.
- J. Zhao, S. E. Zirka, Y. I. Moroz and T. Matsuo, "Physical Cauer circuits in nonlinear eddy-current modeling," Journal of Magnetism and Magnetic Materials, 2020.