Determination of oil preservation types from atmospheric gases to contextualize DGA in power transformers
Authors
Z.H. DRAPER, J.J. DUKARM - Delta-X Research, Inc., Canada

Summary
The oil preservation system of a transformer can significantly influence the amounts of fault gas observed in a transformer for dissolved-gas analysis. Awareness of the gassing behavior of a transformer is one of the primary ways for an engineer to detect an incipient fault in the transformer. Therefore, it is necessary to understand the effect that the oil preservation system may have on the health assessment of a transformer. In this paper, we investigate the relationship between concentrations of dissolved O2 and N2 and the oil preservation system of a transformer. By doing so, we hope to provide insight into how to qualify DGA results based the likelihood that the oil preservation system will lose fault gas over time. We find that several major categories of oil preservation systems can be categorized on an O2 – N2 diagram using support vector classification methods. This enables a more nuanced classification scheme than the use of a simple O2/N2 ratio limit, which was recently included in the IEEE C57.104-2019 guide for transformer DGA interpretation. We find that the transformers with the lowest average levels of gas in them are pressure-regulated N2-blanketed transformers, although the IEEE guide incorrectly suggests that those transformers should be assessed using higher gas concentration limits, according to the O2/N2 ratio.
Keywords
DGA, O2/N2 ratio, Oil Preservation type, Power transformers, Risk assessment1. Introduction
IEEE C57.12.80-2010 [1] offers four definitions related to oil preservation systems. In a "conservator" system, the main tank oil expands into an auxiliary oil compartment containing a gas space. A "sealed conservator" system has a conservator tank with a membrane of some kind providing a barrier between oil and air. A "positive pressure oil preservation system" employs a compressed gas bottle and a pressure regulator to ensure a positive pressure in the gas space. A "sealed-tank" system provides a gas space in the main tank allowing the oil to expand and contract over a specified temperature range. Pressure and vacuum relief valves protect the tank from extremely high or low pressures. In addition, there are "free-breathing" systems that connect the gas space directly to the outside atmosphere via a pipe [2]. For systems that are in contact with the air, they may have a desiccant filter on the inlet to prevent moisture intake. Unfortunately, there are no standard classification codes to differentiate major oil preservation systems of a transformer, like there are for the cooling system or LTC.
IEEE C57.104-2019 [3] introduced an O2/N2 ratio limit of 0.2 to distinguish between highand low-oxygen transformers. A limit equivalent to O2/N2 = 1/5.94 = 0.168 was derived for the same purpose from a different database in [4]. The rationale for the limit is stated in Section 5.4 of [3]: "The O2/N2 ratio was proposed for evaluation as a proxy for distinguishing sealed units from free breathing ones. This approach was used to evaluate the large database where this information was mostly absent, and the break point based on the data suggested the limit of <0.2 or >0.2." Thus, it was assumed that high-oxygen transformers are the ones that exchange gases with the atmosphere, losing a portion of any fault gases formed internally, while low-oxygen transformers are the ones that retain fault gases. That is why, it was thought, the percentile-based DGA assessment limits for high-oxygen transformers are lower than those for low-oxygen transformers.
In other research, it has been observed that the O2/N2 ratio fails to classify N2-blanket transformers as "breathing" because nitrogen pressure regulation tends to keep the oxygen concentration low [5]. Because N2-blanket transformers expel headspace gas over thermally driven gas pressure regulation cycles, they also tend to lose fault gas over time, and therefore should logically have lower DGA assessment limits. However, for those transformers O2/N2 is consistently less than 0.2, for which IEEE C57.104-2019 recommends higher DGA limits.
For individual oil samples, atypical O2 and N2 concentrations can indicate air exposure and potential gas loss during sampling, handling, or laboratory processing. Oil samples with indications of air exposure or contamination should usually be excluded from DGA assessment and trend analysis in their own right.
2. Data for this study
A large North American electric utility contributed DGA data for 225,238 oil samples from 11,529 transformers for research. From this database, samples and transformers were removed when appropriate before performing a statistical analysis.
Concentrations of O2 greater than 30,000 ppm and concentrations of N2 greater than 100,000 ppm were considered unreliable and possibly erroneous measurement values. For reference, the 99th percentile (in the entire database) of O2 and N2 concentrations was 28000 and 97900 ppm, respectively. Transformers with less than five oil samples were excluded. The standard deviation of the O2 concentration was calculated for each transformer and used to determine how consistent the oxygen concentration was over the history of the transformer. An extreme standard deviation was regarded as a sign of sampling or measurement problems. Any transformer with an O2 standard deviation of at least 7000 ppm was removed. The 99th percentile of the standard deviation of O2 in the database with at least five samples was 6920 ppm. After samples
and equipment were removed in this manner, 3924 transformers remained for the analysis.
For investigating the relationship between O2 and N2 concentrations and oil preservation types, we use the medians over all the oil samples associated with each transformer. The oil sample data also included the commonly measured hydrocarbon gases and carbon oxide concentrations, which we use for context below.
2.1. Harmonizing oil preservation labels
Designations for oil preservation systems in DGA databases are often user text entry fields without a selection list of standardized labels. Therefore, the labels are not necessarily reliable or accurate. Here we attempt to organize the labels found in our data into groups that represent particular types of oil preservation system. The harmonized categories and their original designations can be seen in Table 1. This also illustrates the need for an industry-standardized classification scheme on oil preservation types.
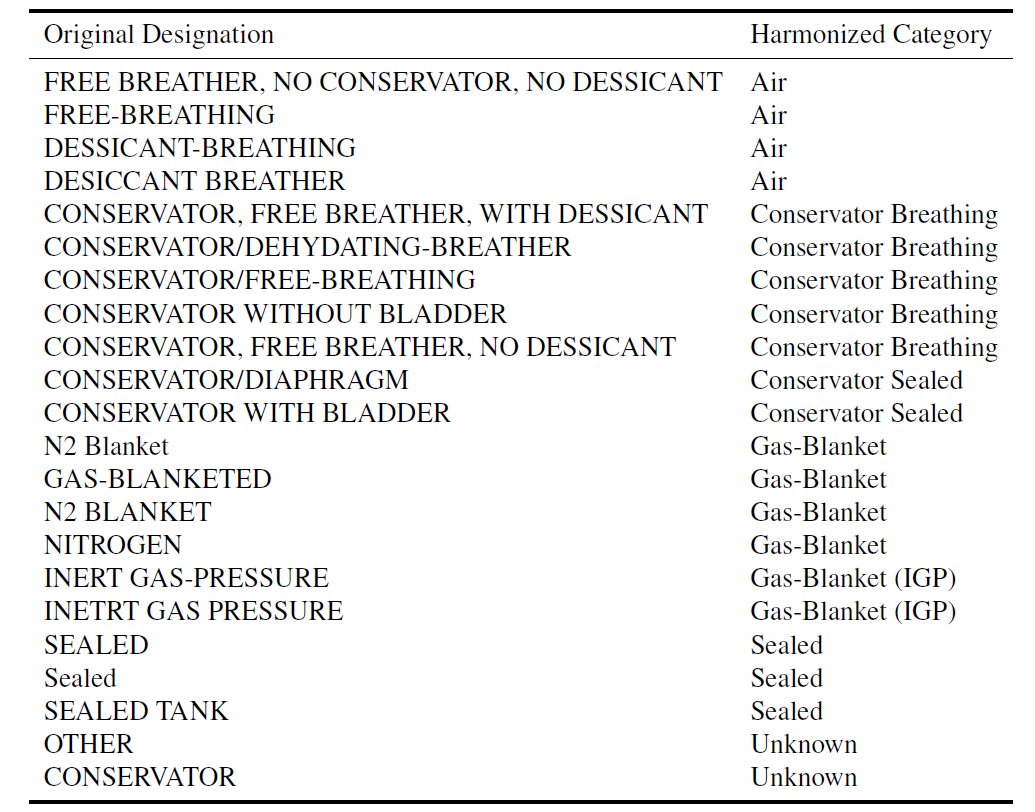
Table 1 - User-entered oil preservation types and the harmonized categories they were assigned to
2.2. Conservator-Breathing is equivalent to Free Air Breathing
The plots shown in Figure 1 of O2 and N2 data for equipment identified as conservator-free breathing and free air breathing without a conservator show that the distributions are very similar. Free-breathing transformers with a conservator appear to be indistinguishable from those with a simple breather pipe, based on the O2 and N2 data alone. We therefore merge those two groups into a single "Air" breathing category. For an Air saturation point based on the data, we use the modal values of the base-ten logarithms of O2 and N2 concentrations. Those modal values – 4.3 for O2 (∼20,000 ppm) and 4.8 for N2 (∼63,000 ppm) – are indicated by solid black lines in Figure 1.
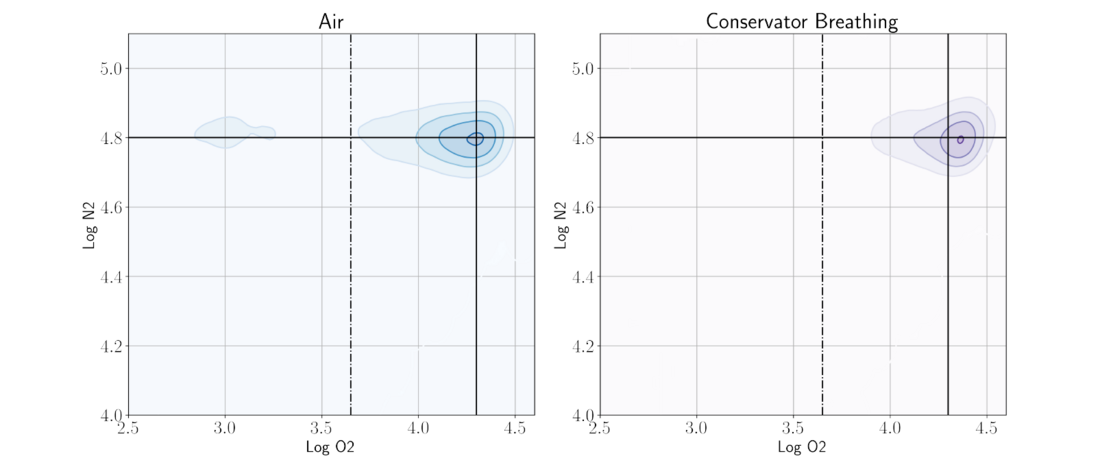
Figure 1 - Density contours for transformers identified as Air type (left) versus Conservator Free-Breathing (right). The solid black lines denote modal O2 and N2 concentrations for Air transformers. Since the two distributions are very similar, we merge them under the Air oil preservation class label
The air saturation concentrations at standard temperature and pressure of O2 and N2 in mineral oil can be calculated as 33480 and 64760 ppm respectively using Ostwald coefficients [6]. This is in general agreement with the empirically derived values noted above for transformers exposed to air.
In the leftmost chart (Air) in Figure 1, there is a small but appreciable cluster where the log O2 concentration is close to 3.0 (∼1000 ppm) while the N2 concentration remains near the air saturation level. Oxygen contributes to the degradation of the insulating oil and paper within the transformer. We speculate there may be other factors on the low-oxygen cluster, such as transformers with a blocked desiccant breather that allows oxygen to be depleted by chemical processes, high inhibitor content, or the young age of the oil at the time of sampling. This illustrates a paradoxical aspect of classifying transformer breathing types based solely on O2 and N2 data. It may seem very counterintuitive that a transformer with this low range of O2 concentrations is more often than not an air breather.
2.3. Sealed, Gas-blanket, Inert Gas Pressure
Unfortunately, a standard nomenclature is not established to distinguish a system that has a sealed N2 gas cushion that is not necessarily positively pressurized, versus a system with a nitrogen bottle that feeds a regulated positive pressure system with a pressure relief valve. In this context, "inert gas pressure" (IGP) almost always means "nitrogen gas pressure", because nitrogen is the most economically viable inert gas for transformer oil preservation. A "sealed" transformer may have N2 injected into the headspace – to flush out any other gases present there – but not actively replenished. The Sealed, Gas-Blanket, and Gas-Blanket (IGP) distributions of O2 and N2 log concentrations plotted in Fig. 2 overlap strongly, with Sealed and Gas-Blanket each having two distinct clusters emerging, neatly separated by the line log10(O2) = 3.65. The single cluster of Gas-Blanket (IGP) corresponds to Group A.
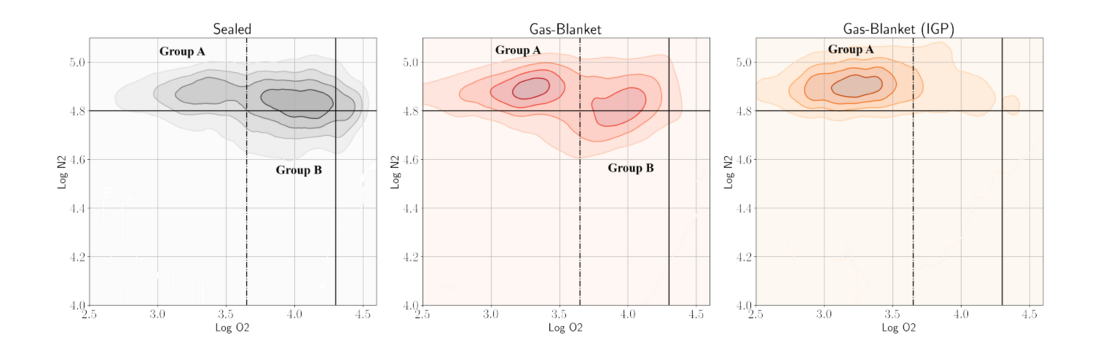
Figure 2 - Illustration of log10(O2), log10(N2) density contours for data labeled as either Sealed, Gas-Blanket, or Gas-Blanket (IGP). The three categories strongly overlap but have varying degrees of preference towards two distinct distributions of data, Group A and Group B. Black lines denote modal O2 and N2 concentrations for "Air" breathing data. The vertical dashed line in all three charts represents log10(O2) = 3.65, which separates Group A from Group B
The bimodality is further illustrated by plotting histograms of the logarithmic concentration of O2 for the Sealed and Gas-blanket groups, as shown in Fig. 3. In both distributions, a vertical line at log10(O2) = 3.65 separates the modal peaks. That line is also plotted for reference in Fig 2.
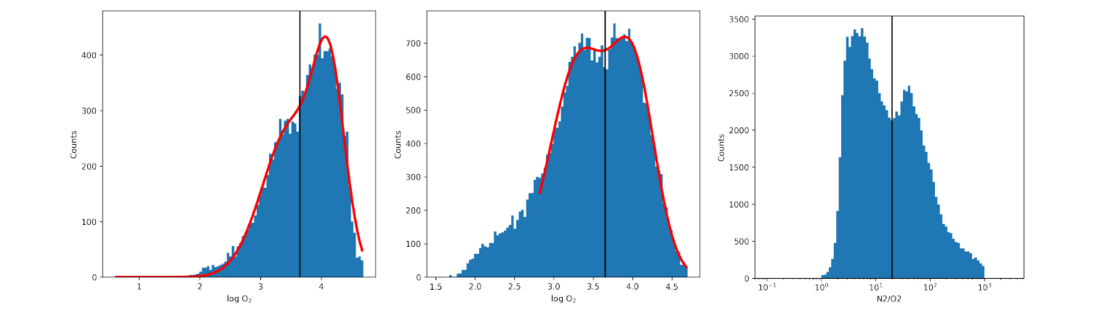
Figure 3 - Histograms show log10(O2)=3.65 separating Groups A and B for both Sealed (Left) and Gas-Blanket (Center) systems. The N2/O2 histogram (right) shows that N2/O2 = 20 (equivalently O2/N2 =0.05) separates the bimodal distribution of the gas ratio. This suggests that there is a stronger presence of nitrogen blanketed systems in our data compared to the study in [4].
The O2/N2 histogram (the rightmost chart) in Fig. 3 has a bifurcation at O2/N2 = 0.05, which is very different from the IEEE’s 0.2 or the corresponding value 1/5.94 = 0.168 derived in [4], suggesting that the respective databases had different proportions of oil preservation types and raising the rhetorical question of whose database should be used for finding a generally recommended threshold value for selecting DGA limits based on values of O2/N2. Ideally, the oil preservation class should be determined a priori, so that more consistent values can be derived.
By inspection of Fig. 2, Group A can be characterized as having superatmospheric N2 concentration, with low O2 concentration. Group B has atmospheric or slightly above atmospheric N2 concentrations, with medium but still subatmospheric O2 concentrations. Group A corresponds to positively pressurized systems, which (as noted in the Introduction) have greater than atmospheric N2 nitrogen pressure and low concentrations of O2, as gasses are expelled to the atmosphere during internal thermal pressure regulation cycles. Group B corresponds to sealed but not pressure-regulated nitrogen blanketed systems, which may sometimes experience higher than atmospheric N2 pressure, but not by injection of N2 gas. Occasional vacuum relief or air leaks under negative pressure may admit some atmospheric O2 into the headspace.
Since the Gas-Blanket (IGP) and Gas-Blanket are both predominantly Group A, we merge both into a single Gas-Blanket category and leave Sealed as a separate category that is predominantly Group B.
2.4. Four Main Class Types
After harmonizing oil preservation type labels and viewing the natural distribution of the O2 and N2 data, we can conclude that four main types of oil preservation systems can be determined from the O2 and N2 data.
- Conservator-Sealed systems are the dominant type at low O2 and N2 concentrations.
- Air-breathing systems are mostly clustered around the O2 and N2 atmospheric saturation point for mineral oil. Some of them are found in another cluster with near-atmospheric N2 levels, but very little O2. We speculate that there may be other factors causing low O2 levels in these systems.
- Gas-Blanket systems are characterized by super-atmospheric levels of N2 (>65,000 ppm) and low concentrations of O2 (<4000 ppm).
- Sealed systems are characterized mainly by atmospheric to super-atmospheric levels of N2 (≥ 65,000 ppm) and moderate levels of O2 – not atmospheric saturation levels, but not very low concentrations either (4000−10,000 ppm).
Density contours for these four classes are plotted in Figure 4.
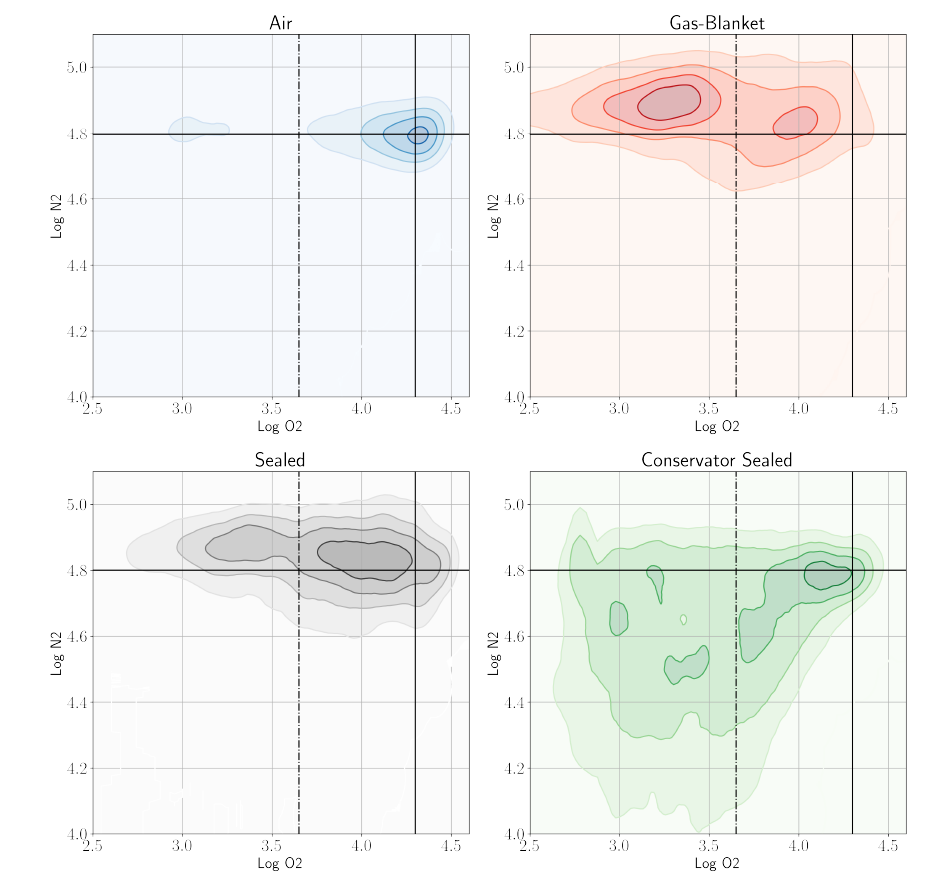
Figure 4 - Contour density plots showing the data for the four main classes of oil preservation type. Solid black lines denote the modal point of Air. Dashed black line denotes the O2 division line between Group A and Group B from Fig. 2
3. Analytical solution to classify oil preservation systems
Now that the data has been relatively cleaned of erroneous data and the labeling harmonized to four distinguishable system types, we develop a methodology to classify the label based on gas concentrations. In this problem, we have median O2 and N2 concentrations for each transformer labeled. Machine learning techniques offer ways to categorize or group large amounts of data such that other subsequent uncategorized data can be inferred based on the available O2 and N2 concentrations. Even when the oil preservation type is already well known, like Conservator Sealed, but the diagnostic returns a high degree of belief for an Air breathing transformer it could indicate sample mishandling. Or it enables the asset manager to flag the equipment that may have had its bladder/diaphragm ruptured. Even if we don’t take the diagnosis literally, it proves to be a useful tool for DGA interpretation in power transformers.
Support vector machines (SVM) is a supervised machine learning method. An SVM-based classifier is called a support vector classifier (SVC). Because SVC finds hyperplanes to divide the data space into classification zones which maximize the separation of pre-defined data clusters, it was the most logical choice of methods for our purposes. Using a linear SVC, in the two-dimensional O2 – N2 plane, those boundaries are straight lines. We obtained two boundary lines given by the following equations:
N2 = 0.555*O2 + 64000 (1)
N2 = -0.481*O2 + 56000 (2)
The lines divide the plane into three classification zones, as shown in Fig. 5. In the red zone below the yellow dashed line (2) is the Conservator Sealed group. In the gray zone above the black dashed line (1) are the Gas-blanket and Sealed groups. In the red zone between the lines is the Air group. Due to the location of Sealed group being close to Gas-blanket group, it was not possible separate the Sealed group using a linear method. It should be noted that the primary way to distinguish the oil preservation system is really the N2 concentration and not the O2 concentration. By choosing a randomized 80/20 testing-training split of the data, we obtained a true positive rate of 70% for this classification scheme.
For better localization of the groups in the O2 – N2 chart, we also used a radial basis function (RBF) SVC. Gamma for the kernel was chosen to be 3, for more constrained distributions. The classes were also balanced by number of data points to prevent any larger class from having more influence. A regularization parameter of 0.025 was chosen. The result, shown as white contours around the groups in Fig. 5, was localized pockets. The RBF fit also matched the general shape of the density contours for each group. With a randomized 80/20 testing-training split of the data, we obtained a true positive rate of 73% for the RBF version of the classifier.
For comparison, a gray dotted line corresponding to the IEEE O2/N2 = 0.2 limit and a solid black line corresponding to air saturation in oil O2/N2 = 0.5 are included in Fig. 5. Between those lines are the high-O2 air-exposed units and a few Conservator-Sealed transformers at lower N2 concentrations. Above the O2/N2 = 0.2 line, in the low-O2 region, there are some Conservator- Sealed systems, which retain almost all DGA gases and also all of the N2-blanket systems, which routinely purge gas from the system. Applying the same DGA assessment criteria to these dissimilar groups selects gas concentration limits that are too high for Gas-Blanketed systems and too low for Conservator-Sealed systems.
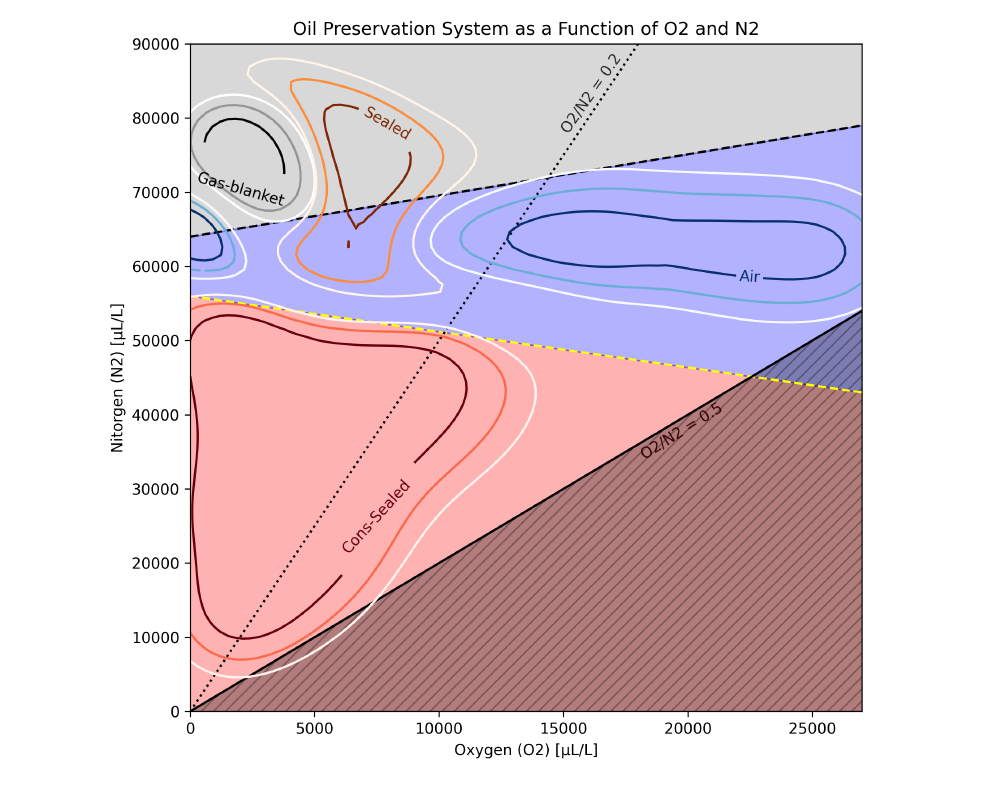
Figure 5 - Gray, blue, and red zones are defined by the linear SVC classifier. The dashed black line represents equation (1), and the dashed yellow line represents equation (2). The contours represent the RBF SVC classifier. The dotted black line represents the IEEE limit O2/N2 = 0.2, and the solid black line represents the air saturation level O2/N2 = 0.5
For comparison, a gray dotted line corresponding to the IEEE O2/N2 = 0.2 limit and a solid black line corresponding to air saturation in oil O2/N2 = 0.5 are included in Fig. 5. Between those lines are the high-O2 air-exposed units and a few Conservator-Sealed transformers at lower N2 concentrations. Above the O2/N2 = 0.2 line, in the low-O2 region, there are some Conservator- Sealed systems, which retain almost all DGA gases and also all of the N2-blanket systems, which routinely purge gas from the system. Applying the same DGA assessment criteria to these dissimilar groups selects gas concentration limits that are too high for Gas-Blanketed systems and too low for Conservator-Sealed systems.
4. Relevance to DGA fault severity assessment
One of the primary reasons for identifying the transformer’s oil preservation type is to provide context for DGA fault severity interpretation. In IEEE C57.104-2019 [3], it was reasoned that different sets of DGA limits should be used for low-O2 versus high-O2 transformers. The stated rationale was that, to varying degrees, some fault gas will be lost to the atmosphere depending on the oil preservation system. The data itself naturally bifurcated on an O2/N2 ratio to provide two sets of high and low percentiles.
In [4] the distribution of median O2/N2 over all transformers was found to be bimodal; the bifurcation was located at O2/N2 = 0.168 (originally stated as N2/O2 = 5.94). Similarly, IEEE C57.104-2019 found a bifurcation stratifying the transformer population accordingly by O2/N2 ratio of 0.2, which led to the derivation of percentile-based DGA limits that are substantially lower for high O2/N2 transformers in IEEE C57.104-2019.
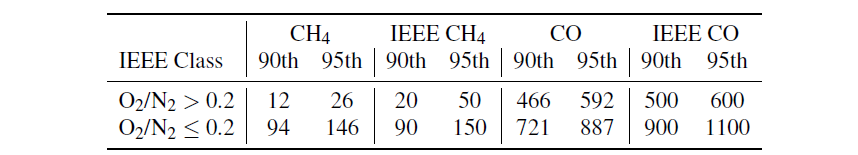
Table 2 - Gas concentration percentiles for CH4 and CO compared to IEEE DGA limits when stratifying by O2/N2 = 0.2
For Table 2, we stratified the data by an O2/N2 ratio of 0.2. Then we measure the 90th and 95th percentiles. It can be generally seen that the ch4 and co gas concentrations are sometimes matching and sometimes different than those derived from IEEE, but not extremely inconsistent. Given they were derived from different data sets, it is only logical for there to be differences. Yet, the main trend of high O2/N2 having lower gas values and lower O2/N2 having higher gas values is still consistent with what was found in IEEE C57.104-2019. We conclude that if you separate the data in such a way, you will get similar results. It is logical to assume that this bifurcation in the data is genuine in both data sets.
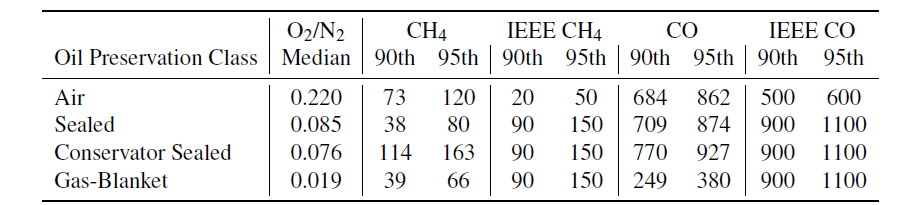
Table 3 - Gas concentration percentiles from the data set for CH4 and CO compared to IEEE DGA limits, when based on the oil preservation class
For Table 3, we instead stratified the data by the apparent oil preservation system using the oil preservation types as given and then grouped those as described above into the four main harmonized types. For each of those types, we selected the cases where the concentrations of O2 and N2 were consistent with the given type according to the RBF SVC classifier (Fig. 5). This was done to exclude exceptional cases such as, for example, a conservator-sealed transformer that has a broken bladder or a pressurized gas-blanket transformer with a severe air leak. If instead we do not exclude the exceptional cases, there are minor differences in the numbers, but the overall results are the same.
We calculated the median O2/N2 ratio for each oil preservation class for comparison with the IEEE limit of 0.2. Only the Air breathing category exceeds the established 0.2 limit. We also calculated the 90th and 95th percentiles for CH4 and CO concentrations in each class to compare with the relevant IEEE DGA limits. The oil preservation class having the lowest combustible gas concentrations, as shown in Table 3, is Gas-Blanket. Although according to IEEE C57.104- 2019 the higher gas concentration limits should be used because of the low median O2/N2 ratio for that class. There is a clear mismatch between the levels of gas measured versus the limits derived from IEEE C57.104-2019.
Furthermore, it is interesting to note that Air breathing transformers semm to only have modest gas loss compared to Gas-blanket systems. This suggests that a passive breathing system via natural diffusion is less susceptible to gas loss than an actively pressurized Gas-blanket system.
Sealed units also appear to have lower observed gas concentrations despite an expectation that they are sealed from the air. Perhaps this is due to the difficulty in separating Gas-Blanket systems from truly Sealed systems both in terms of accurate labels and with O2 and N2 data (See Figure 2).
We therefore show that the percentiles as derived by the O2/N2 ratio are inconsistent with values when viewed by labeled oil perservation type.
Conclusions
Classifying transformers based on high-O2 or low-O2 concentrations, or by a simple O2/N2 ratio limit, fails to distinguish transformers that experience higher or lower levels of gas loss. For example, transformers with low O2 due to gas loss by nitrogen pressure regulation versus those with low O2 due to being airtight. Or conservator-sealed systems with a high O2/N2, but low overall concentrations of either. It also appears that gas-blanketed transformers experience more gas-loss than air-breathing transformers. As a result, a set of DGA limits for fault gases was misinterpreted from the data. The result is that limits are inappropriately being applied to transformers according to the method prescribed by the IEEE DGA guide [3].
A simple diagram based on transformer median concentrations of O2 and N2 is able to reasonably distinguish between air-breathing, sealed, conservator-sealed, and nitrogen blanketed oil preservation types. Then appropriate statistical DGA limits can be derived for each of those types. Rather than having to identify the apparent oil preservation type from the gas data in each case, it would be preferable to have industry-standard labels for the common oil preservation classes to categorize by similar levels of gas loss affecting the DGA interpretation.
References
- IEEE standard terminology for power and distribution transformers. IEEE Std C57.12.80-2010 (Revision of IEEE Std C57.12.80-2002), pages 1–60, 2010.
- J. R. Meador and N. E. Dillow. Transformer oil preservation. Transactions of the American Institute of Electrical Engineers. Part III: Power Apparatus and Systems, 76(3):1208–1211, 1957.
- IEEE guide for the interpretation of gases generated in mineral oil-immersed transformers. IEEE Std C57.104-2019 (Revision of IEEE Std C57.104-2008), pages 1–98, 2019.
- Fredi Jakob and James J. Dukarm. Thermodynamic estimation of transformer fault severity. IEEE Transactions on Power Delivery, 30(4):1941–1948, 2015.
- James J. Dukarm and Zachary H. Draper. Dissolved-gas analysis for nitrogen-blanketed transformers. In 2020 IEEE PES Transmission & Distribution Conference and Exhibition - Latin America (T&D LA), pages 1–5, 2020.
- A. Müller, M. Jovalekic, and S. Tenbohlen. Solubility study of different gases in mineral and ester-based transformer oils. In 2012 IEEE International Conference on Condition Monitoring and Diagnosis, pages 937–940, 2012.