A3 - In-service circuit breaker condition assessment
Authors
Phil MOORE - Elimpus Ltd, United Kingdom
Keith WILLIAMS, Mark WALDRON - National Grid, United Kingdom

Summary
This paper describes the trial of a circuit breaker monitoring (CBM) system which makes combined mechanical and electrical measurements during in-service operations. The CBM system is portable and can be installed on a circuit breaker within 2 hours without requiring an outage. The measurements include electric field, vibration, radio frequency and trip/close coil current and are made ±300ms either side of the operate signal . Electric field signals act as a voltage transformer for the reactor terminals. Vibration signals are based on piezoelectric technology and require post-processing to derive the envelope of the signal. Vibration signals allow assessment of the start of the movement of the operating mechanism, and the effectiveness of the damping. Radio frequency measurements are classified as either low frequency – including arc instability, grading capacitor and re-ignition emissions – or high frequency, including partial discharge events. Arc instability emissions are as a result of the change in arc inductance associated with the intense cooling from the insulating gas; typically between 5 and 15 individual emissions have been recorded from all circuit breakers in the trial. The presence of arc instability emissions is not detrimental, but there should be an approximate balance of emissions across the phases. Grading capacitor emissions can occur within 100ms after current interruption and are due to internal sparking within individual capacitor units caused by the highly stressed voltage conditions. Re-ignitions of the arc generate extremely high RF emissions that invariably exceeds the dynamic range of the measurement system, as well as transients in the reactor voltage. Partial discharge signals can be present during the period that the operating mechanism is active, suggesting that their emission is related to mechanical agitation. In addition to providing conventional timing information, by analysis of the measured signals the CBM system can detect developing issues with interrupters, grading capacitors and operating mechanisms. The system was trialled on 6 separate circuit breakers switching 200 MVAr shunt reactors. During a 30 month trial, the CBM detected issues on 4 of the 6 circuit breakers monitored including late re-ignitions, controlled switching relay problems, interrupter issues and drive train defects. All of the issues detected are explained and accompanied by relevant waveforms. Two of the circuit breakers monitored were removed from service for refurbishment as a result of the trial. On a strip down of one of these, puncture holes in the interrupter casing were discovered which correlates with data recorded by the CBM system which indicated uncontrolled arcing. The trial has been very successful and supports a condition/performance based intervention regime which leads to better use of system resources and greater HV equipment availability for transmission systems migrating towards net zero.
Keywords
High Voltage, Circuit Breaker, Switching, Re-ignition, Vibration, Overvoltage, Grading Capacitor, Partial Discharge, Radio Frequency, Diagnostic1. Introduction
Condition assessment of HV equipment is essential to the migration towards condition-based, as opposed to time-based, maintenance. The wider benefits to the utility in this approach include improved asset availability and a reduction in operational expenditure. However, further economies in resources and system access can be achieved if the condition assessment information is recorded with the HV equipment in service, potentially negating the need for maintenance if no issues are detected. In the case of circuit breakers, the most pertinent information relating to the performance of the switching operation must be collected in a very short time interval (e.g. 200 ms) either side of the operating instruction.
This contribution describes the trial of a technique for assessing the condition of transmission voltage level circuit breakers during in-service operations. The study specifically relates to shunt reactor switching using 400kV gas circuit breakers and is an extension, and further development, of a previously reported project to identify failing grading capacitors [1]. The study was conducted over a 2 year period and involved 6 circuit breakers from several equipment manufacturers, spanning installs from the 1980s to current designs, in both AIS and GIS settings. The monitoring equipment used to collect the condition assessment information was non-intrusive and could be installed in-situ in approximately 2 hours. The equipment, which was typically left to monitor each circuit breaker for several weeks, could be remotely accessed and would remotely indicate all operations.
Unlike conventional circuit breaker condition monitoring techniques, which focus on accessible, mechanical aspects of performance such as operating time, mechanism charging time etc., the circuit breaker monitoring (CBM) approach described here additionally provides data on the electrical performance of the circuit-breaker. The combined mechanical and electrical measurements available from CBM system can provide a more complete picture of the status of the equipment, more fully supporting a condition/performance-based intervention regime and thus allowing interventions to be planned on the basis of the needs of the equipment. This approach leads to optimised resource usage and greater HV equipment availability, both of which are critical in the transformation of transmission networks towards net zero.
2. Circuit breaker monitoring system
2.1 Overview
An overview of the circuit breaker monitoring (CBM) system is shown in Figure 1. The hardware has been ruggedized both for outdoor operation, and the harsh electromagnetic environment experienced close to a circuit breaker. The electric field sensors (3x), vibration sensors (3x) and trip/close coil current inputs (4x) are sampled by a low frequency acquisition module operating at 200kSps with sufficient memory to record ±300ms either side of the trigger point – normally the trip or close pulse. By comparison, the three radio frequency (RF) inputs are directly sampled by a high frequency acquisition module (1.5GSps, 750 MHz bandwidth) which uses a segmented memory approach allowing 128 individually triggered RF waveforms to be recorded following the main trigger signal from the low frequency acquisition module. The operation of the analogue input modules is controlled by a processor which additionally, following a circuit breaker operation, records all data to memory and remotely informs the user via a 4G modem. The 4G modem also enables remote downloading of the recorded data.
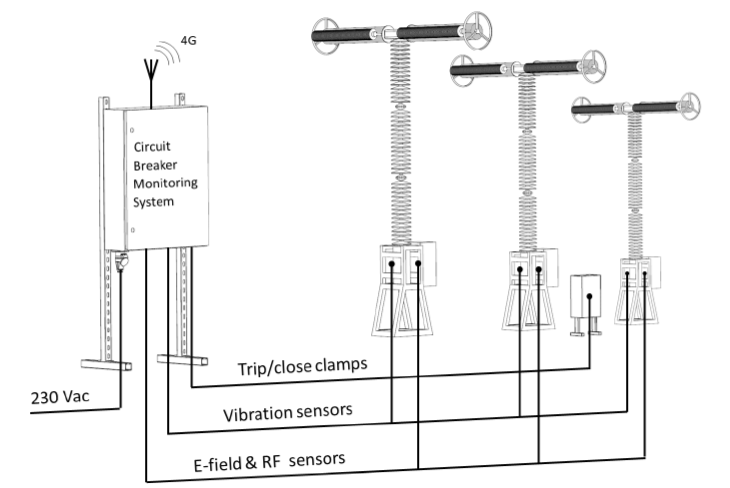
Figure 1 - Overview of circuit breaker monitoring system
2.2. Vibration
The vibration sensors are based on piezoelectric technology that resonates at 36kHz. The sensors are enclosed in a sealed metal box which are clamped to the circuit breaker structure, close to the operating mechanism – see Figure 2. Care is taken to ensure that the sensors are fitted to the same position on each phase.
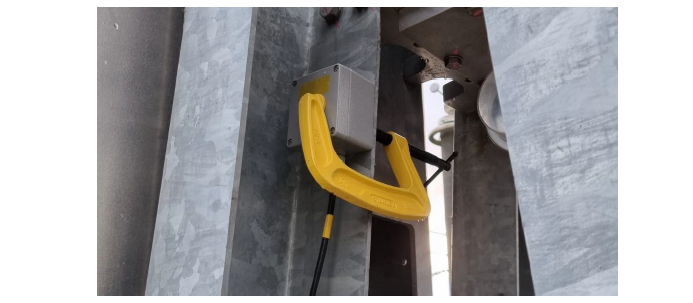
Figure 2 - Vibration sensor in situ
Figure 3a shows a typical open operation vibration graph from a hydraulically operated AIS circuit breaker, where the origin represents the start of the trip signal. This data is then processed via a Fourier technique to reveal the envelope of the waveform, Figure 3b. The vibration sensors are used for
- Determining the delay between the trip or close command and the movement of the operating mechanism. It is very apparent from Figure 3, that the operating mechanism begins moving 20ms after the trip command.
- Determining whether the damping is effective during an open operation. Any lack of damping in the opening movement would be apparent as an increase in the vibration signal after the position where the contacts are fully open – typically in the region 40 – 60ms. Figure 3a is a good result, the initial energy from the operating mechanism which accelerates the contacts apart at 20—30ms, is greater than subsequent signals at 40-60ms.
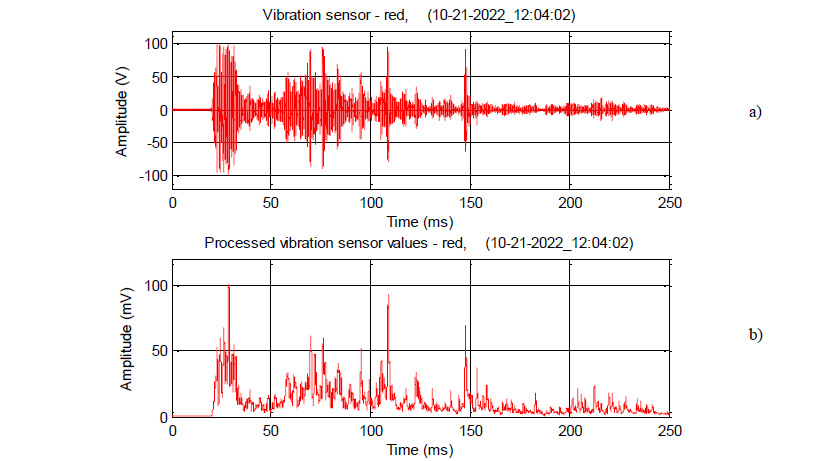
Figure 3 - Vibration data from open operation. a) raw data, b) processed
2.3. Electric Field sensors
Electric field (EF) sensors act as wideband voltage transformers for the reactor terminal voltage. An example is given in Figure 4 which shows the transition of the three phase voltages from 50Hz to the reactor transient frequency (typically 1.5kHz). In this paper all yellow phase waveforms are plotted in green. For AIS applications, the EF signal is derived from the RF sensor described in the section below, whereas for GIS applications the signals are derived from internal PD sensors which allow the passage of power system frequency components. AIS applications require the raw EF signals to be processed to remove the coupling between the phases [1]. The EF signals are capacitively preconditioned to avoid any phase shifts in the amplified signals. For shunt reactor applications, the EF sensors act as a convenient method of determining the point of current interruption which occurs at the start of the reactor transient.
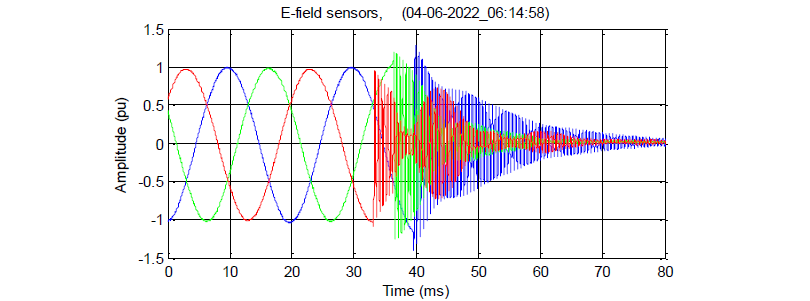
Figure 4 - Electric Field sensor waveforms
2.4. Trip and close coil currents
Clamp type current probes are used to sense the trip or close current signals from the secondary wiring. AC probes, as opposed to DC probes, are preferred for longer duration monitoring campaigns since they do not require batteries. Typical examples are shown in Figure 5 for trip coil current signals from a circuit breaker fitted with a controlled switching relay. Note that, for the applications covered in the trial, only a single close coil current clamp was needed.
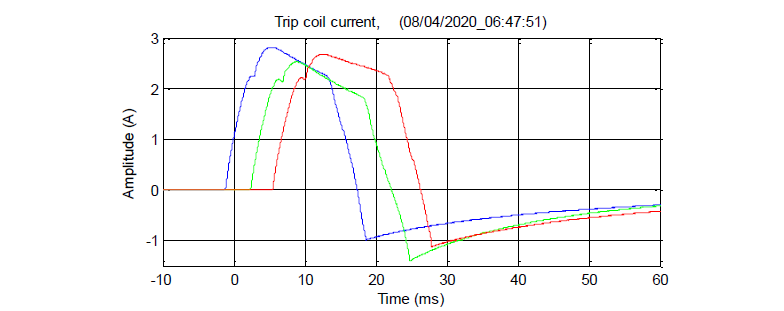
Figure 5 - Trip coil currents from circuit breaker fitted with controlled switching relay
2.5. Radio Frequency emissions
During the circuit breaker switching process several, differing effects can generate very high rates of change of current that contain components which extend into RF spectrum; as a consequence, these effects can be detected by antennas. One of the effects is the ignition of an arc, either through a close operation, or as a consequence of an open operation. In either case, a rapid breakdown across the interrupter contacts generates a significant, impulsive RF emission. Note that the extinction of an arc, due to the current passing through a zero crossing, does not generate a measurable effect using the equipment described in this paper. The RF emissions are detected using monopole antennas that are temporarily clamped to the switchgear structure, as shown in Figure 6. The clamping positions are chosen such that the antennas are approximately 5m from the nearest interrupter and, similarly to the vibration sensors, fitted to the same position on each phase. The antenna signals are directly sampled by the RF acquisition module of the CBM system without any additional amplification. Experience has shown that RF emissions from circuit breaker operations can be reliably measured above the noise environment commonly encountered in both indoor and outdoor substations; the noise environment predominantly consists of communications transmissions such as mobile phone, data services, radio and television signals. Although impulsive radiated RF signals are commonly measured from other AIS HV equipment sources [2] they are unlikely to be recorded in any significant quantity, if at all, during the ~200ms interval following a CB switching command: any signal of this type will not influence the results of the CB assessment. Due to the high sampling rate of the RF input – 1.5GSps or one sample every 0.67 ns - the timing delay is used to determine the phase of origin [1].
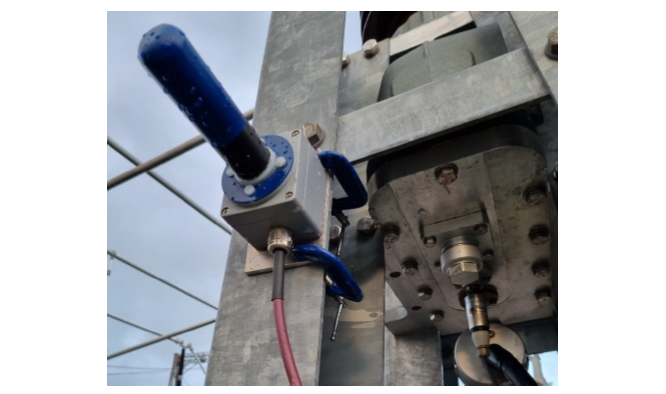
Figure 6 - RF antenna clamped to the supporting structure of the blue phase interrupters
There are essentially four types of signal that are of interest during a circuit breaker operation, typical examples are shown in Figure 7. All of the signals are impulsive, and arise from abrupt changes in currents associated with the circuit breaker.
Figures 7a, 7b and 7c shows low frequency emissions where the dominant frequency is 5-20 MHz. Low frequency emissions arise where the change in current occurs in the same direction as the line current, i.e. longitudinally, not in the direction of the primary electric field between the interrupter and earth . In the context of a CB open operation, this signal can represent either an emission from the arc due to instability, an emission from a grading capacitor, or a re-ignition. For a given circuit breaker arc instability and grading capacitor waveforms can look very similar. Hence, it is the presence, or otherwise, of the arc that determines the origin of the signal.
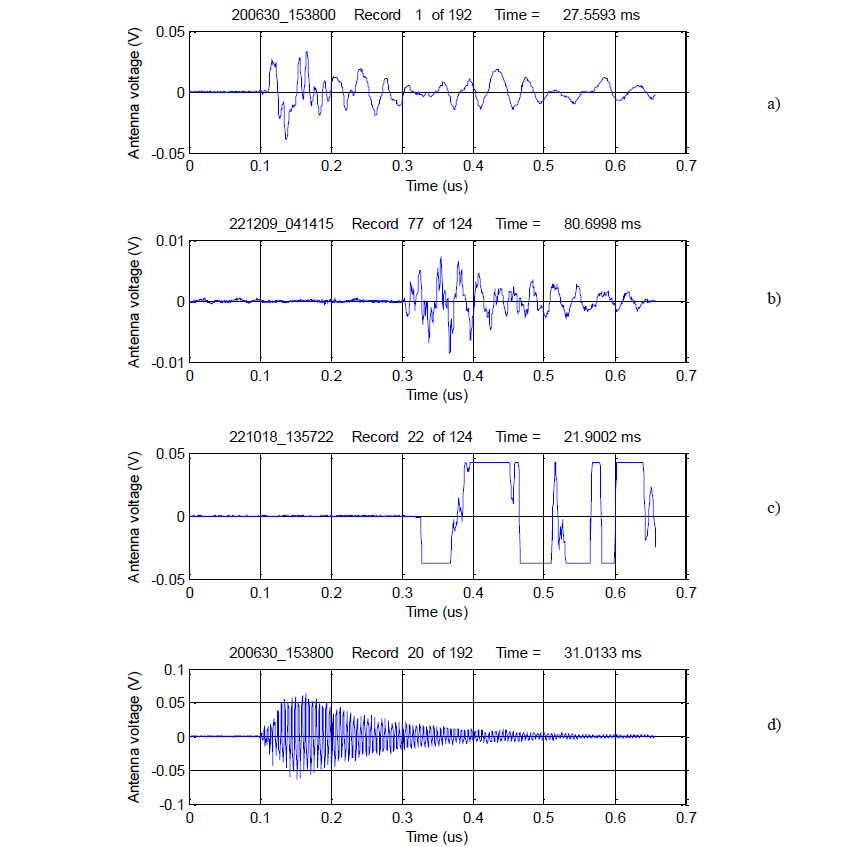
Figure 7 - Examples of RF signals. a) arc instability discharge, b) grading capacitor discharge, c) re-ignition, and d) partial discharge
Arc Instability emissions
See Figure 7a. Signals generated during the arcing phase are caused by sudden changes in arc inductance associated with arc instabilities introduced by the intense cooling process inherent to the operation of a gas interrupter [3]. These signals have been observed in all the shunt reactor CB opening measurements taken during the trial. Experience has shown that, for a fixed arc duration, the emissions per phase (typically 5-15) should be equal across the phases when measured over several operations. Any deviation from this metric could be indicative of increased arcing times, or changes in the position of the arc within the circuit breaker.
Grading capacitor defects
See Figure 7b. Emissions from grading capacitors have previously been reported [1] and arise from sparking within the individual capacitor units which rapidly degrades the dielectric integrity of the whole capacitor assembly. This effect is normally apparent within 100ms of the arc extinguishing, during a period when the grading capacitors are exposed to high voltages due to the net difference between the busbar voltage and reactor transient. Further proof that these signals originate from grading capacitors is provided by the fact that these emissions are never present for shunt reactor CB not fitted with grading capacitors.
Re-ignitions
Figure 7c shows a low frequency emission caused by a re-ignition in a reactor CB. This is typical of a dielectric re-ignition [4]. Again, the frequency response of this signal is very similar to the Figure 7a, but the distinguishing factor is that the signal has exceeded the input limits of the CBM system, i.e. the signal is clipped. In general, a re-ignition signal is between 103 and 105 times greater in amplitude than an arc instability, or grading capacitor, emission which presents a major challenge in the dynamic range of the RF inputs. However, little information is lost due to the clipping of the signal whereas it is clearly beneficial to maintain the RF input signal sensitivity sufficiently high to measure the arc instability and grading capacitor emissions.
Partial discharges (PD)
Figure 7d shows a typical PD emission: this signal has a much higher frequency content in excess of 300MHz. High frequency signals of this type are generated by current changes occurring in the electric field between the system voltage and the earth plane, e.g. in a direction perpendicular to the primary current flow. PD can occur before, during and after the arcing phase. Since these signals only occur during the period that the operating mechanism is active (i.e. as evidenced by the vibration signal), it is assumed that mechanical agitation is implicit to their presence. A possible cause for the presence of PD is movement of particles within the interrupter chamber. Small episodes of PD signal emission (e.g. up to 10 events per operation) have been frequently measured during CB operations during the trial and are not considered a cause for concern.
3. Trial on shunt reactor switchgear
The CBM system was trialled on gas circuit breakers, of differing generations, from several manufacturers switching 400kV, 200MVAr shunt reactors in both air insulated (AIS) and gas insulated substations (GIS). A total of 6 circuit breakers were monitored between June 2020 and December 2022. Each circuit breaker had 2 interrupters per phase and were a mix of spring and hydraulically operated mechanisms. In all applications of the CBM system there were no outages needed for installation. Mostly, the scheduled operations of the circuit breaker being monitored provided the data for the trial; occasionally requests to the System Operator for operations were made if the CBM system had not recorded any data after several weeks of being in situ.
4. Results
4.1. Re-ignitions
Absence of controlled switching relay
Re-ignitions are inevitable on circuit breakers switching shunt reactors without the use of a controlled switching relay since the movement of the interrupter contacts is essentially a random event. Figure 8 shows the EF waveform from a typical example of this effect from a GIS circuit breaker. The re-ignition occurs at 33 ms on the blue phase and is accompanied by a large RF impulsive emission similar to Figure 7c and a large spike in the voltage. On the circuit breaker monitored, over a 4 month period and a total of 91 operations, the number of re-ignitions recorded were red = 16, yellow = 14 and blue = 14. Thus, for every operation there was a 49% probability of a re-ignition.
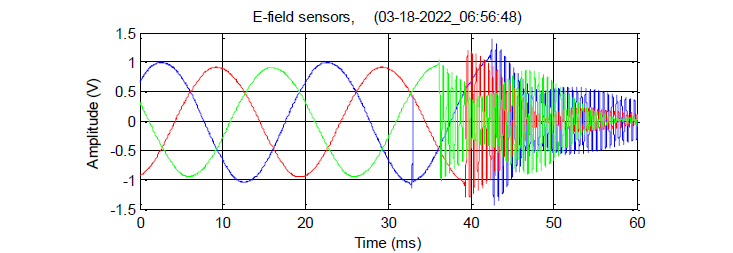
Figure 8 - Electric field waveform during re-ignition on blue phase
Late re-ignition
Figure 9 shows two EF results from an AIS circuit breaker fitted with a controlled switching relay (CSR). In general, the CSR successfully eliminated re-ignitions by ensuring the interrupter contacts parted at the beginning of a current half-cycle. Figure 9a shows the blue phase EF from a successful opening operation where the trip command occurred at graph origin and the current interruption occurs at 28.7ms which is the start of the reactor transient. However on one occasion, out of a total of 29 recorded operations, a re-ignition was detected following the normal current interruption - see Figure 9b. In this figure a re-ignition occurs at 30.3 ms causing a spike in the voltage and large RF emission; the current was successfully interrupted 5us later. It can be seen from Figure 9b that the re-ignition and subsequent current interruption has perturbed the reactor transient voltage causing a change in both the phase and amplitude. Note that the initial current interruption also occurs at 28.7ms, demonstrating that the CSR is not at fault. The exact cause of this late re-ignition is unknown at this time, however any re-ignition which occurs with the contacts far apart is problematic due to the risk of uncontrolled arcing, see section 4.3. Since the circuit breaker successfully opened the shunt reactor despite the re-ignition, this event is accepted as being an outlier, however, future monitoring will be conducted to ensure that the re-ignition frequency does not increase.
4.2. Control Switching Relay defect
Figure 10 was recorded from an AIS circuit breaker fitted with a CSR. On every operation, a re-ignition was detected on the blue phase at approximately 10ms before the final current extinction. Although the voltage spike was relatively small, e.g. in comparison with Figure 8, it still produced a clipped RF emission. A re-ignition at this position implies that the CSR is incorrectly opening the interrupter contacts too early, just before the end of a current loop, causing a very short arcing time.
The re-ignition results shortly after the current naturally extinguishes. A similar effect was also detected on the yellow phase. This issue was traced to a commissioning error where the incorrect reactor type had been selected in the CSR settings. The circuit breaker was recommissioned with the correct reactor setting and further testing demonstrated that it was free of re-ignitions. Further monitoring will be conducted to determine if damage to the interrupters becomes apparent as a result of the incorrect setting.
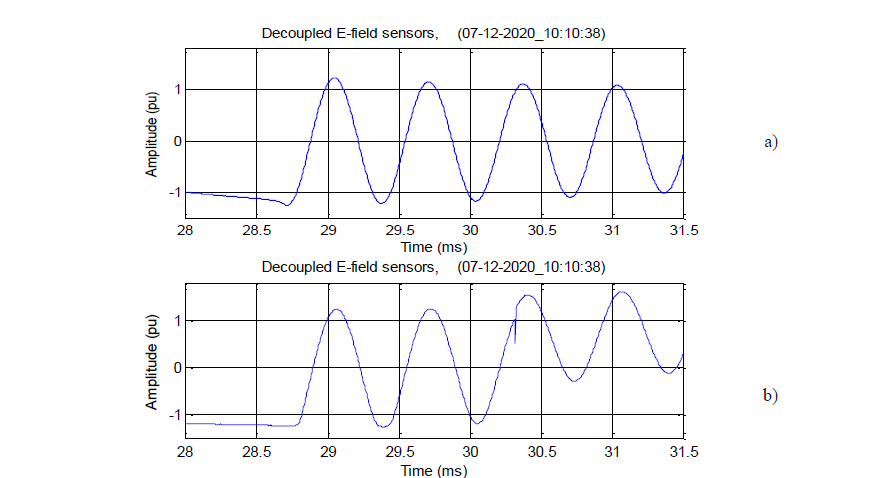
Figure 9 - Reactor transient voltage during opening operation, a) Upper, normal operation, b) lower, with re-ignition
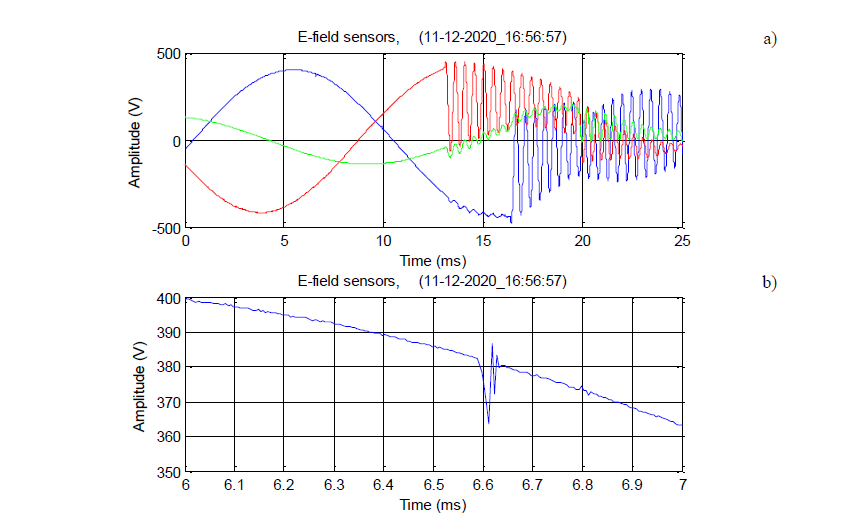
Figure 10 - Re-ignition caused by incorrect CSR setting. a) EF signals (not decoupled), b) close-up around re-ignition on blue phase
4.3. Interrupter Issues
A serious defect in a GIS circuit breaker (no CSR fitted) was detected by observing the EF waveforms and re-ignition record. Re-ignitions were recorded on every operation of this circuit breaker - sometimes there were multiple re-ignitions. In Figure 11, shows a detailed view of the blue phase around the point of current interruption at 21.2ms, at the start of the reactor transient.
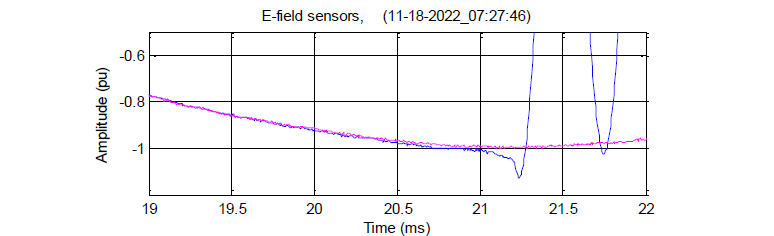
Figure 11 - EF waveforms for opening operation.
The magenta waveform shows the blue phase busbar voltage which begins to differ from the reactor terminal voltage after 20.0ms due to the arc voltage within the interrupters. At current interruption, the reactor voltage is -1.08 pu. Following interruption, due to current chopping, the reactor voltage continues to increase in magnitude until it reaches the suppression peak of -1.16pu at ~21.25 ms. The suppression peak is influenced by both the arc voltage and current chopping: an increase in the arc voltage will increase the suppression peak. Table 1 shows the suppression peak values for the blue phase, together with the number of re-ignitions detected and the sequence of operations recorded.
| Operation # | 1 | 2 | 3 | 4 | 5 | 6 |
|---|---|---|---|---|---|---|
| # of re-igns | 1 | 1 | 1 | 0 | 3 | 0 |
| Sup pk (pu) | 1.29 | -1.31 | 1.22 | -1.16 | -1.52 | 1.26 |
It can be seen from Table 1 that the suppression peak abnormally reached -1.52 pu on operation 5, whereas the value did not exceed 1.31 pu for the other operations. On operation 5, the initial re-ignition (42.7ms) was accompanied by two further re-ignitions within the reactor transient period (49.1 and 69.1 ms). It is believed that on this operation, on the first re-ignition, the arc re-ignited outside of the interrupter chamber in an area not well served by the gas flow. In this case the increase in arc voltage was uncontrolled, leading to an abnormally high suppression peak and two further re-ignitions. The circuit breaker was taken out of service after operation 6. When dismantled, the interrupter casing was discovered to have puncture holes caused by abnormal re-ignitions as described earlier – see Figure 12. There were however, many puncture holes present in the casing demonstrating that this behaviour had been continuing for some time before the circuit breaker was monitored.
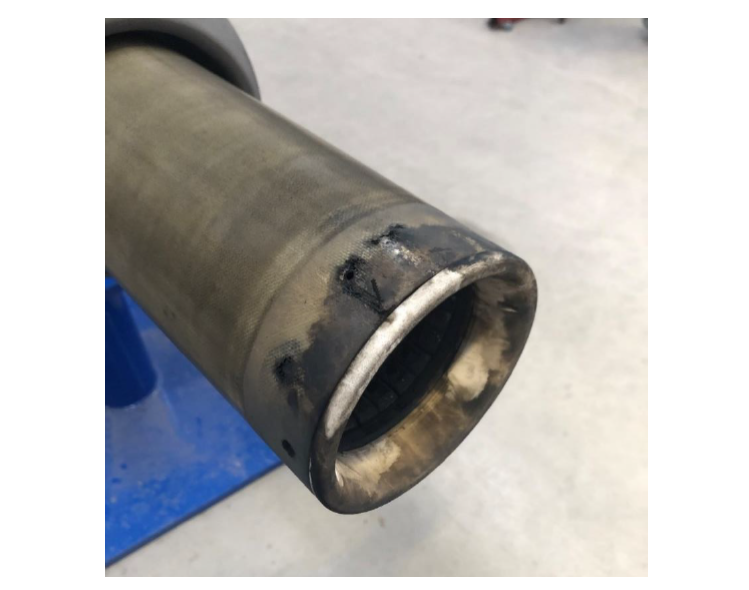
Figure 12 - Puncture holes in the interrupter casing
4.4. Drive Train defect
When the circuit breaker of the previous section was returned to service following refurbishment, the CBM system was used to determine that the repair was effective. All open operations were deemed to be correct. However, the close operations showed timing differences between the phases which should not be present since all the close coils are operated in series. Figure 13a shows the EF waveforms, and Figure 13b shows the processed vibration signals. It can be seen from Figure 13b that the blue mechanism begins to move first followed ~8ms later by the yellow phase and another 18ms later by the red phase. This is reflected in the EF results where it can be seen that the red phase closure has been delayed by 20ms. After several more operations, the CB issued a ‘phases not together’ alarm and automatically opened. This issue was traced to hydraulic oil residue on the closing lever between the operating close coil plunger and the hydraulic actuator pilot valve causing stiction leading to a delay in operation.
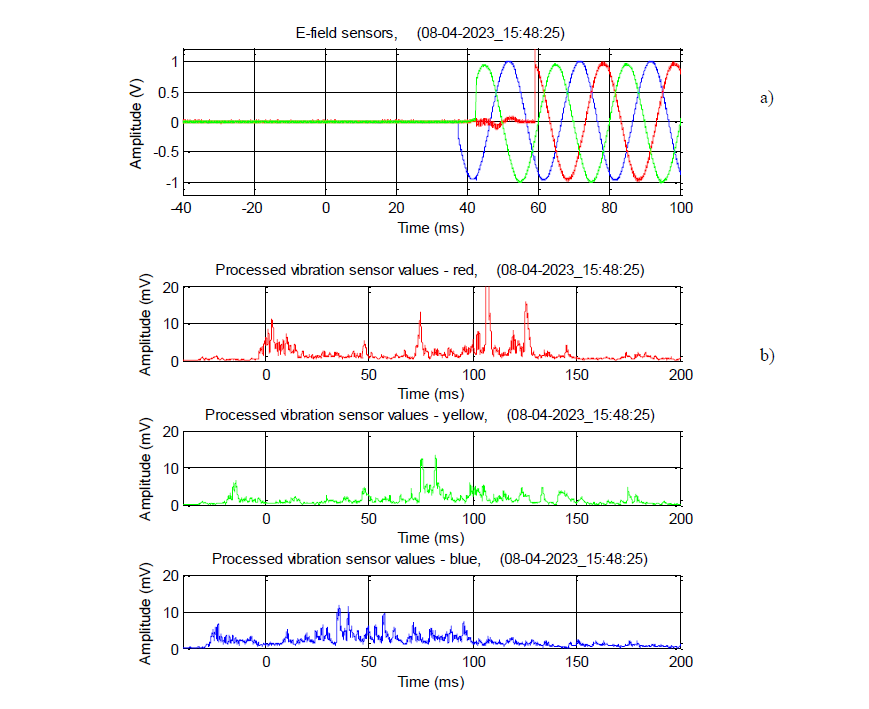
Figure 13 - Delayed closing operation
5. Discussion
5.1. Value of the monitoring approach
The trial has proved that the CBM system can detect developing issues within circuit breakers without requiring invasive access or outages. This leads to the following benefits:
- Increased circuit breaker availability and reliability
- Reduced requirement to carry out routine maintenance
- Operational expenditure savings
- Greater ability to prioritise the deployment of resources
- Reduced requirement to remove and test grading capacitors offsite
Of the six circuit breakers monitored, two were discovered to operate correctly, one has a minor defect that is being monitored, one required recommissioning and two were withdrawn from service for refurbishment. Whilst two of the circuit breakers had suspected issues, the CBM approach has provided information that hastened the decision to move towards refurbishment. However, of the remaining four circuit breakers -which were all expected to operate correctly - the CBM approach demonstrated that issues existed.
The anticipated cost of the CBM system is less than 10% of the circuit breaker cost, however this does not consider system unavailability costs. Inclusion of these costs could make the overall cost-benefit significantly more attractive.
5.2. Extension of the CBM approach to a wider application of circuit breakers
The success of the trial has spurred interest in further deploying the CBM system to a wider range of circuit breaker applications. For non-reactive circuit breakers it is anticipated that the CBM system will need to additionally measure line currents since the point of current interruption of, say, a bus section circuit breaker cannot be readily determined from the EF waveforms. Other than this change, there is no barrier to applying the CBM system to all circuit breaker applications. An anticipated benefit for low duty circuit breakers is to monitor the performance after a long idle time.
The CBM system was originally designed to be mobile, thus allowing it to be moved around the circuit breaker population. However, the trial has demonstrated that monitoring has provided additional insight into the health of 4 out of the 6 circuit breakers monitored. At this level of success, it is debatable whether high operation count circuit breakers should be monitored by a mobile system, or fitted with a permanently installed system. Whilst this decision is more easily made on a cost/risk balance – beyond the remit of this paper - a potential fleet-wide approach to the utilisation of the CBM system could be to provide fixed installations for
- High operation count applications, e,g, shunt reactors, capacitor banks.
- Low operation count applications with high impact consequences, e.g. line circuit breakers that repeatedly operate for transient faults.
Mobile CBM systems would be restricted to all remaining circuit breaker applications on a periodic basis.
References
- P Moore and K Williams, ‘In-service Diagnosis of Grading Capacitor Dielectric Deterioration’, (paper A3-204, CIGRE Paris Session, 2020).
- I E Portugues, et al, ‘RF-Based Partial Discharge Early Warning System for Air-Insulated Substations’, (IEEE Trans on PD, Vol 24, No 1, Jan 2009, pp 20-29).
- G E Gardner and R J Urwin, ‘Arc instability and current chopping in an air-blast interrupter’, (Proc IEE, Vol 124, No 7, pp619-627, July 1977).
- R D Garzon, ‘High Voltage Circuit Breakers: Design and Applications’, (CRC Press, 2002).