Drag coefficient modelling for OHL conductors
Authors
S. STEEVENS, E. ULLOA JIMENEZ, J. UNTERFINGER - Amprion, Germany
N. HÖLSCHER, I. GÜVEN - Niemann Ingenieure GBR, Germany
M. PASSMANN - Ruhr University Bochum, Germany

Summary
This study investigates the modelling of the drag coefficient of overhead conductors to optimize their aerodynamic performance under different conditions. Conductors with Z-shaped wires in the outer layer have a smoother surface and lower wind resistance compared to those with round-shaped wires, especially in upper critical Reynolds number ranges. The research includes wind tunnel measurements on different conductor types, taking into account the effects of conductor tension and bundle configurations. The results show that conductors with Z-shaped wires significantly reduce the drag coefficient, which can be used for cost-effective and efficient transmission line design. In addition, a reduction factor for bundled conductors is introduced, which takes into account the shielding effects within the bundle, leading to a further reduction in wind action. The results of the study suggest that the current DIN EN standards should be updated to better reflect these aerodynamic benefits.
Keywords
OHL, drag coefficient, wind load, reduction factor, bundle conductors1. Introduction
In the current version of the overhead transmission line standard according to [1], a uniform drag coefficient is applied for wind load verification cases. Variations dependent on different conductor types and, more significantly, different wind velocities (which is reflected in the Reynolds number) are not considered in the calculation approach. To achieve noise reduction in reconductoring projects, larger diameter conductors must be installed. This installation results in increased wind loads, which can only be counterbalanced by an improvement (reduction) in the drag coefficient to maintain approximately identical wind loads.
As a transmission system operator, Amprion GmbH is constantly developing its conductors for use in the high and extra-high voltage grid. The aim is to achieve an optimum balance between electrical performance and mechanical properties. In the best case, the conductor diameter should be increased for the same weight. However, the increase in cross section is accompanied by a corresponding increase in the wind load on the conductor due to the increased wind-exposed area, so the most favorable aerodynamic behavior should be ensured [2]. Previous research has shown that for single conductors, the drag coefficient is not constant but varies with changing wind velocity and can be expressed as a function of the Reynolds number [3].
Conductors with Z-shaped wires in the outer layer are aerodynamically particularly smooth and are characterized by a relatively low drag in the Reynolds number range which is decisive for nature-. They are primarily examined for their noise reduction capabilities. The primary objective is to increase the conductor diameter, which consequently reduces the electric field strength and thereby minimizes noise emissions. The drag is practically independent of the conductor pre-tension. This article presents recent fundamental tests on new types of conductors and discusses further approaches. Among other things, the topic of wind shielding effects on bundle conductors is discussed.
The results of wind tunnel tests on the drag of conductors with round-shaped wires and other structures with external Z-shaped wires are also presented. Depending on local conditions, the load case for wind load may be dimensioning, which must be examined and considered on a case-by-case basis. The fundamental principle for determining wind loads at mast locations are established in Standards [4] and [5]. These standards enable both the determination of wind loads using wind load maps and a more precise site-specific analysis. The latter allows for a more accurate assessment of wind loads at specific locations by taking into account topographical features, land use characteristics, and transmission line-related parameters.
2. Wind tunnel measurements
As part of an R&D project, aerodynamic measurements were carried out on conductors at the Ruhr University Bochum.
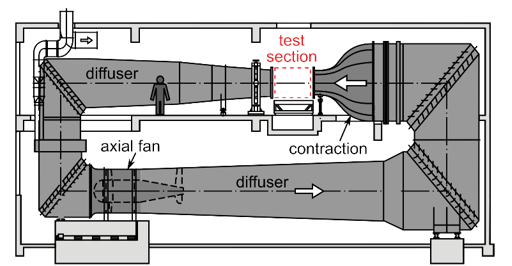
Figure 1 - Open jet wind tunnel of the Ruhr University Bochum
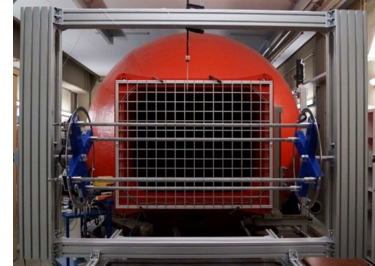
Figure 2 - Test rig for measuring wind forces on pretensioned original specimen of single or bundle conductor
The airflow in the wind tunnel is driven by a powerful fan with a drive power of 150 kW, which can achieve wind speeds of up to 60 m/s in the free jet. Due to the strong constriction of the flow cross-section in the wind tunnel nozzle from an initial circular cross-section with d ≈ 3.5 m to a rectangular outlet cross-section (width x height = 1.5 m x 1.2 m), a turbulence level of less than 0.8% is achieved with contraction ratio of 7:1 in the center of the jet. The jet expansion is less than 5° for the open test section of 2.5 m length.
The degree of turbulence is increased to about 4% with a grid of flat bars arranged crosswise. The aim of this arrangement is to simulate the effects of wind turbulence on overhead power lines in the wind tunnel, with a flow velocity that is as homogeneous as possible over the entire cross section of the jet. While a large proportion of the natural gusts in the atmospheric wind still act as slow changes in wind direction and do not need to be replicated in the wind tunnel, the remaining proportion of smaller and faster gusts of lower intensity are artificially imposed on the initially low-turbulence flow at the nozzle outlet with the aid of the grid [6][7].
The integration of a turbulence grid into the wind tunnel was implemented to achieve sufficient turbulence intensity levels, with the grid characteristics validated through hot-wire anemometry measurements. In the context of conductor drag analysis, an accurate representation of the atmospheric flow properties under experimental conditions is crucial. The primary parameter of interest is the root mean square (RMS) value of velocity fluctuations—specifically, the turbulence intensity of the longitudinal flow component—which takes precedence over the turbulence spectrum in terms of replication requirements. However, the spectrum remains significant as it defines the turbulent length scale.
Conductors, due to their significantly small diameter relative to atmospheric mean gust dimensions, experience wind turbulence predominantly as an increase in mean wind speed. This phenomenon is taken into account in the calculation of drag forces using aerodynamic coefficients derived from experimental data and gust wind speed. To determine the turbulence frequency threshold below which drag coefficient remains unaffected, the turbulence spectrum can be divided into three distinct scales:
- Large scale fluctuations, manifested as gradual changes in wind direction
- Medium-scale eddies, which contain the predominant energy content of the turbulence spectrum
- High-frequency fluctuations, resulting in corresponding high-frequency load variations
This classification is qualitative and varies according to the relative dimensions of the object compared to the turbulent eddy sizes. The present study focuses primarily on the reproduction of turbulence fluctuations that potentially influence the primary flow field around the conductor, specifically the medium-sized eddies vortices that contain the majority of theturbulent energy content. This criterion is considered satisfied when the turbulence intensity of the wind tunnel inlet flow approximates the full-scale target values.
It should be noted that spectral analysis of the measured velocity fluctuations remains ongoing, and the determination of length scale is pending completion. These analyses will further contribute to the accurate reproduction of real flow conditions in the experimental setup.
3. Conductor Properties and Test Specimens
Conductors for overhead lines consist of round-shaped wires concentrically stranded in alternating directions. Their electrical and mechanical properties are specified in DIN EN 50182 [8] and are taken into account in the design of overhead lines. The electrical properties, such as specific conductor resistance and reactance coating, are used to determine the current carrying capacity of the conductor and the system geometry. In a simplified calculation model (IEC TR 61597 [9]), the thermal expansion of the conductor is defined by the coefficient of thermal expansion, the mechanical expansion by the modulus of elasticity and the time expansion by creep.
The construction of conductors with round-shaped wires according to [8] inevitably results in gaps between the wires. A long time ago, the use of deformed wires was recognized, mainly to increase the aluminum cross section of the conductor and thus its conductivity. Subsequently, trapezoidal and Z-shaped wires were developed and conductors made from these new shaped wires with concentrically stranded layers were standardized in DIN EN 62219 [10] in 2003. However, the improvement in electrical properties is associated with contraindications, including the increased weight of the conductor and the increased cost of manufacturing the individual wires and stranding the conductor. As a result, the use of conductors according to [10] has rarely been adopted as a standard.
In the development of low-noise conductors for reconductoring project [11], the initial focus was on increasing the conductor diameter to reduce the edge field strength and thus corona noise. However, the electrical improvement also led to a mechanical deterioration as the larger diameter increased ice formation and the area exposed to wind. The increase in the area exposed to the wind causes an increase in the tensile forces on the tower. The modelling of the forces is defined, for example, in EN 50341-1 [12] and includes three methods for determining the wind resistance coefficients. In the German overhead line standard DIN EN 50341-2-4 [1], the wind resistance coefficient for conductors with a diameter of more than 15.8 mm is set to 1, similar to method 1 of [12]. In other countries, however, Method 2 of [12] with wind tunnel measurements has been used to determine the wind resistance coefficients, e.g. in Belgium, where the values for conductors meeting noise reduction requirements are laid down by law.
Nevertheless, the methods of [12] are all limited to a single value to characterize the property. However, the results of measurements can be fitted mathematically using more complex models. This is the case, for example, with the EPE calculation method [13], where the plastic and elastic behavior of the conductor is simulated by fourth degree parabolas. The determination of these curves is partially explained in various documents such as DIN EN 50182 [8], IEC 61395 [14] or [13]. Unfortunately, a similar determination for wind resistance coefficients on conductors is only available to a limited extent and is not standardized.
The following conductors were analyzed in this study:
- The SA and SB conductors are Amprion's standard conductors with round aluminum wires. They are used for new construction (SB) or refurbishment (SA). The characteristics of the SA conductor were used as a reference for the development of the low-noise conductors.
- The SC, SD, SE, SG and SH conductors are different developments of the low noise conductors with round aluminum wires. Compared to the SA conductor, the diameter has been increased from 22.4 mm to 25.9 mm without a significant increase in weight.
- Conductors S4, S5, S6, S7 and SF are different developments of low noise conductors with Z-shaped wires in the outer layer. These conductors also have a diameter of 25.9 mm but are slightly heavier than the round low noise conductor.
- Conductors S3, S8 and S9 have also been tested to take account of the different conductor diameters of the various structures in the test program.
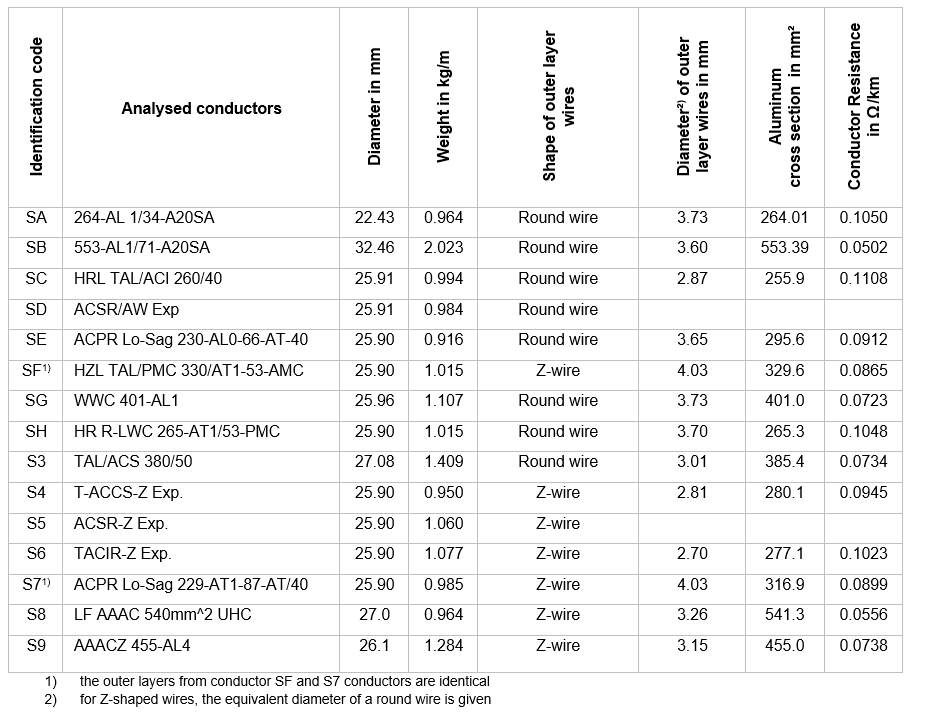
Table 1 - Analyzed conductor
4. Test setup
For the wind tunnel tests, a frame-like test set-up was developed that encompasses the free jet flow and holds the original conductor segments in single or bundled arrangements orthogonal to the wind (Figure 3). The structure is made of high-strength aluminum profiles to achieve an optimum balance between stiffness and weight. It is designed with two adjacent double uprights on either side, which support a cross-shaped conductor holder to hold the conductor in a square 4- or a 2-bundle arrangement. Three distances of 200 mm, 300 mm and 400 mm can be set.
The conductors are braced on one side against an anchor block using tension anchors and fixed to the side supports. Only a light preload of 2.5 kN per conductor is applied via the anchor bolts to compensate for any bending caused by production. This can be increased to approximately 50 kN. The preloading is short-circuited within the frame. An axial bearing on the anchor block allows the conductor support to be swiveled manually even at maximum preload.
The test setup is supported on four load cells with the conductor used, which are placed on a solid wind tunnel table. Identical 6-component force gauges are installed at each of the four support points to record all reaction forces and moments. They are initially designed to absorb the dead weight of the structure. At the same time, they are calibrated to measure the horizontal and vertical wind forces on the conductors with sufficient resolution even over this offset. Figure 3 shows the different conductor configurations in the measurement setup during test preparation.
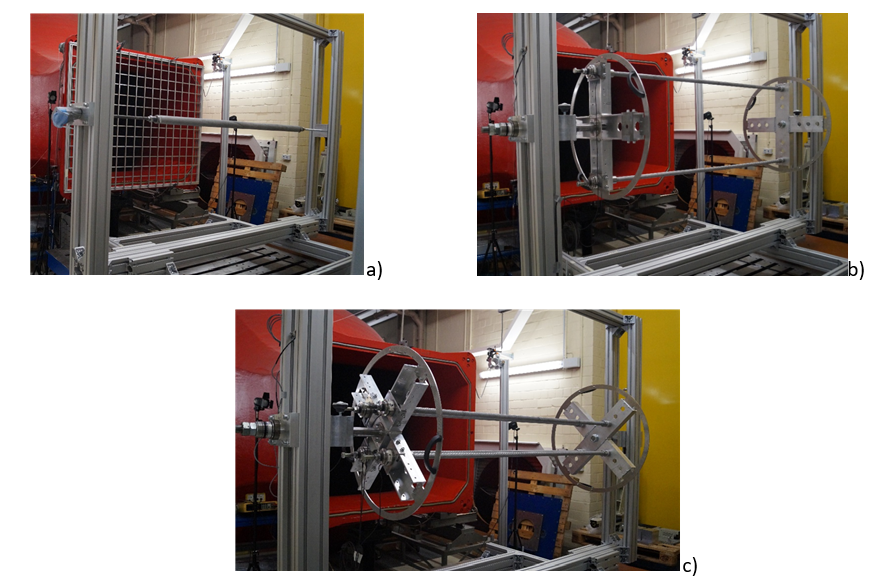
Figure 3 - Test setup for measuring the wind forces a) on a 2:1 enlarged single conductor b) on a bundle of 2 conductors and c) on a bundle of 4 conductors
4.1. Basics of Circular Cylinder Flows
The flow around rounded bodies, known as semi-aerodynamic bodies, and the resulting forces are particularly dependent on the velocity V (in m/s) of the surrounding fluid. The Reynolds number is a dimensionless parameter that compares inertial and frictional forces. For circular cylinders it is defined with the diameter D (in m) as the characteristic dimension and the kinematic viscosity ν of the air (in m²/s) by
(1)
For natural wind, the gust velocity v is decisive as it combines the effect of the time-averaged mean flow and a contribution associated with the gustiness. It is to be understood as a short-term average value over approximately 3 - 5 s of the randomly fluctuating wind speed in turbulent wind and is used in the design of conductors during an extreme storm.
Using the example of a circular cylinder with a smooth surface (Figure 4), ε/D = 0, or a rough surface, ε/D = 0.0913 (ϵ: effective roughness height of the conductor surface, D: conductor diameter), in turbulence-free flow, Iv = 0 %, or turbulent flow, Iv = 4.2 %, the evolution of the drag force as function of the Reynolds number can be described quite well. The Reynolds number varies from Re= 104 - 107 in the range relevant to practical design [15].
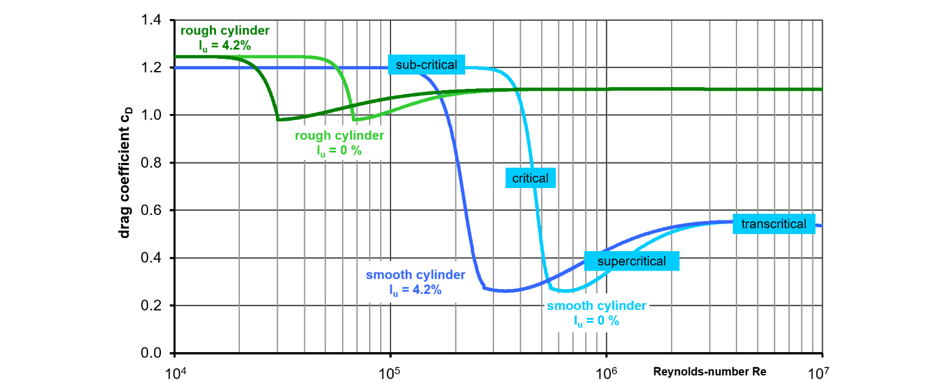
Figure 4 - Drag coefficient CD as a function of the Reynolds number for circular cylinders according to [15]
The wind force generally increases with the square of the wind speed. However, the associated velocity pressure does not convert to the same value for all velocities, so that the wind force in relation to the velocity pressure varies with the wind speed. The drag coefficient cD takes this into account as a shape coefficient and shows different re-regimes of characteristic states of the flow properties in the surface boundary layer close to the contour of the cylinder, depending on the turbulence intensity of the inflow and the surface roughness of the cross-section around the flow.
After a range with subcritical conditions and largely constant wind resistance, the drag coefficient suddenly collapses in low-turbulence flow and on a smooth cylinder with a backward shift in flow separation at the beginning of the critical Reynold number range at Recrit ≈ 3·105 and falls to the critical minimum by Recrit ≈ 5,5·105 to the critical minimum, cyan-colored curve in Figure 4. Towards larger Reynold numbers, the drag coefficient increases again moderately with the transition to the supercritical range and reaches the trans critical regime with slightly larger, but constant wind resistance over Reynolds number.
The literature often quotes the subcritical drag coefficient cD ≈ 1.2 [7] [16], which is confirmed here by the measurements. Based on this, when the surface roughness or the wind turbulence changes with an increase in the Reynolds number, significantly different conditions arise as described above. They can be summarized as follows:
- Increase of inflow turbulence (blue curves in Figure 4):
- Decreasing of the Reynold number with critical flow
- Widening of the supercritical Re range
- No change in drag for trans critical flow
- Increase in surface roughness (light green curve in Figure 4):
- Reduction of the critical flow Re range
- Reduction of supercritical Re range
- Increase in drag for critical, supercritical and trans critical flow
An increase in surface roughness and/or wind turbulence shifts the critical Reynolds number range towards lower Reynolds numbers. The drag coefficient at high Reynolds numbers (trans critical range) increases with increasing surface roughness. Turbulence, on the other hand, practically does not change its value. The characteristics of the circular cylinder flow described above are of particular importance for measurements on conductors. With greater inflow turbulence, the trans critical flow is reached at lower wind speeds on a rougher surface. This early transition to a fully turbulent surface boundary layer is used in wind tunnel experiments to investigate conditions that occur in nature at large Re numbers, even with small-scale models. In the present case, this is not necessary as the available wind tunnel performance for the 1:1 model can be used to achieve conditions similar to those found in nature.
4.2. Drag properties of the single conductor
The measurements carried out in the wind tunnel show a significant reduction in the drag coefficient in the range relevant for the design (from Re ≈ 3.0⋅104 to Re ≈ 1.5⋅105) compared to the subcritical initial value cD ≈ 1.2. Furthermore, a clear difference is evident between conductors with round-shaped wires (S3) in the outer layer and those with Z-shaped wires (S4 to S9) in the outer layer. This difference is mainly due to the smoother surface quality of the conductors with Z-shaped wires, which leads to a significant shift in the critical resistance drop compared to the conductor with round-shaped wires. The low wind permeability of the conductors with Z-shaped wires compared to the more open conductors with round-shaped wires also has a significant influence on the drag behavior of the individual conductor:
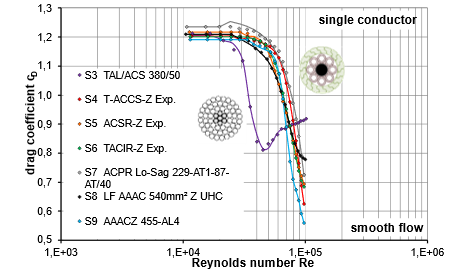
Figure 5 - Drag coefficient of single conductors S3 to S9 in low-turbulence flow (measured in a twin bundle)
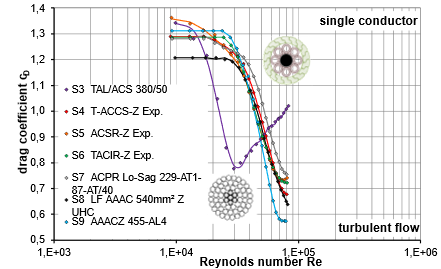
Figure 6 - Drag coefficient of single conductors S3 to S9 in turbulent flow (measured in a twin bundle)
The following technical features contribute to the differences in wind resistance:
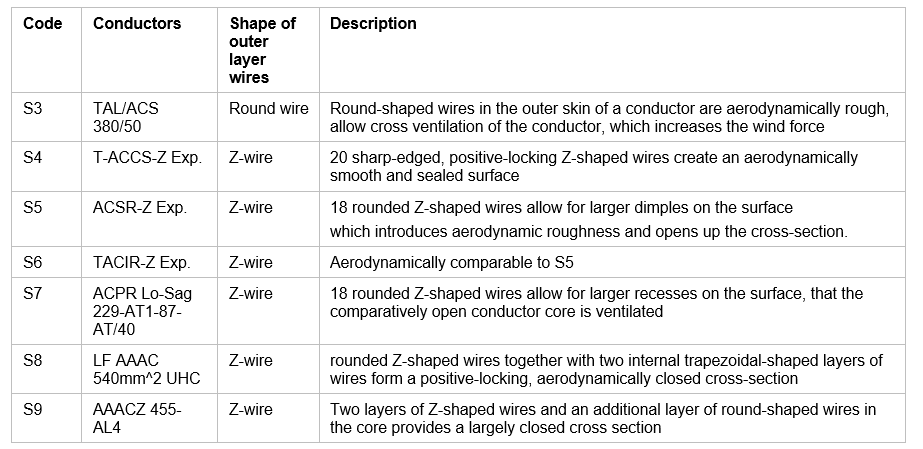
Table 2 - Technical features of the different conductor types
In general, a form-fitting, smooth and closed surface is aerodynamically more favorable in terms of the aerodynamic drag of the individual conductor than conductors with small openings and the possibility of cross-ventilation of the conductor.
A fractional rational function was derived from the measured values for the drag coefficients of the individual conductors to facilitate further processing in practical applications according to the results from Figure 5 and Figure 6:
(2)
The equation maintains its validity for Reynolds numbers up to 105 in laminar flow conditions and extends to Reynolds numbers of 8∙104under turbulent flow regimes. ?1 to ?4, ?1 to ?3 as well as h1 and h2 represent model parameters which are adapted to the respective measured resistance curve depending on the conductor type. These model parameters are available for the test results of low turbulence and turbulent flow measurements.
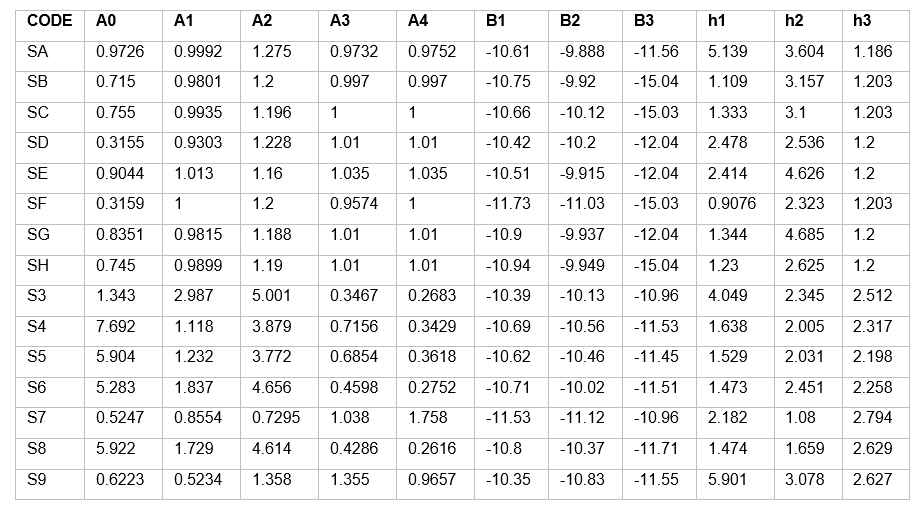
Table 3 - Model parameters
The degree of turbulence of the homogeneous wind tunnel flow is approximately 4.2 %. This corresponds to the small-scale portion of natural wind gusts that is effective in nature in correspondence to the diameter of the conductor. As a result, the wind gusts that are decisive in Central European low-pressure storms are modelled.
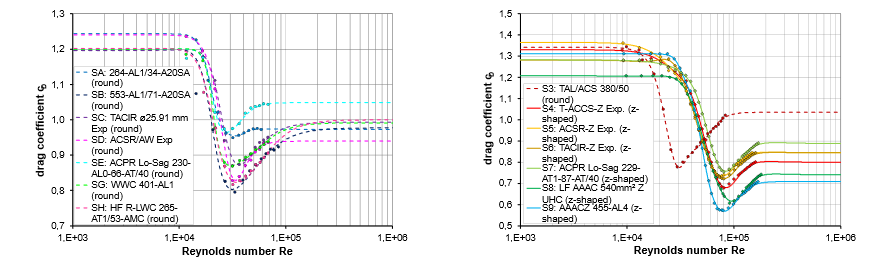
Figure 7a and b: Functional curve for all analyzed conductors in turbulent flow
Figure 7a and Figure 7b show the analytically modelled drag curves derived from the measurement data. The measurement data are introduced via the marking points. Figure 7a shows the drag of the conductor with round-shaped wires. In addition to the aerodynamically rough conductor with round-shaped wires S3 (dashed curve), Figure 7b shows the results of the aerodynamically smoother conductor with Z-shaped wires (solid curves). In each case, the given range of data is extrapolated to the transcritical flow regime as indicated by the extended drag curves. This approach is confirmed by additional data measured on a 2:1 scale model of a Z-shaped conductor. Based on these measured data, the major turning point of the drag curve in the supercritical flow regime has been determined. Combined with data from the literature [17], the onset of the transcritical regime was sufficiently inferred.
Characteristic differences in aerodynamic properties of conductors with round-shaped wires and those with Z-shaped wires in the outer layer come to the fore: depending on the detailed structure of the conductor, the critical minimum drag of Z-wires is only formed beyond Recrit » 3.5 – 8.0×10⁴. This observation is relevant for semi-probabilistic design. This design concept is based on a characteristic wind speed with a return period of 50 years [1]. For typical conductor suspension heights between 25 m and 50 m above ground level, this corresponds to a Reynold number between 3×10⁴ and 1,5×10⁵ based on the decisive gust wind velocity which is approximately 1.6 times higher than the related mean velocity. However, the lower Re-number of 3×10⁴ is relevant for conventional round-shaped transmission lines which are typically smaller in diameter. On the contrary, new Z-shaped conductors are designed with larger diameters to optimize their electrical properties. Accordingly, the Re-number is increased to the given upper limit of 1,5×10⁵ and the aerodynamic features of these new type of conductors reveal a super-critical to an almost transcritical situation. The tests confirm that the aerodynamic drag of the Z-shaped conductors are usually below the equivalent value of a conductor with round-shaped wires. This most favorable aerodynamic feature can be considered in the wind resistant design and can contribute to a more economical design result for the towers.
In the wind tunnel measurements, the preload of the conductors was varied as a further parameter. A preload commonly used in overhead line construction is in the range of approx. 5 kN to 50 kN [18].These tensile forces are compensated within the test rig without affecting the measurement of the wind forces.
Both the conductors with round-shaped wires SA to SE or SH and SG and the conductor with Z-shaped wires SF were subjected to a preload between 0 kN and a maximum of 12.5 kN for the individual conductor. The wind resistance of the conductor with round-shaped wires was clearly influenced by the pretension, while the wind forces of the Z-shaped conductors were only slightly influenced by the preload due to their closed design. Therefore, in a second measurement campaign, the preload of conductors S3 to S9 was limited to 2.5 kN to compensate the production-related curvature of the conductors on the one hand and to be able to construct the test frame approx. 15 % lighter to improve the measurement accuracy on the other. The influence of an increased preload on the conductors with round-shaped wires is mainly due to the associated smoothing of the conductor surface. It is further intensified by conductor compaction and the associated reduction in permeability and cross-sectional reduction.
The influence of the preload on the aerodynamics of the conductor is described in detail below.
4.3. Influence of conductor preload on the flow across the conductor
Conductors with round-shaped wires applied in OHL are installed under strong load, which stretches them and closes the openings in the conductor as the tension increases. This causes the conductor to taper and reduce in diameter. Tightening the conductor with round-shaped wires results in a smoother conductor surface, which reduces the drag of the tensioned conductor compared to the slack conductor. This aerodynamic improvement increases as the preload increases. The influence of preload varies with Reynolds number and is less in the supercritical to trans critical flow range than in the subcritical to critical range. This could be due to the smoothing effect of the preload, which affects the flow separation from the conductor differently depending on its circumferential position. The greatest influence is achieved at a critical Reynolds number, when separation occurs further downstream and the drag of the conductor is at its lowest. Since real conductors are always under significant load, this difference is only important to clarify in the context of experiments.
In addition, the inner structure of the conductor is also compressed with steadily increasing preload, with the result that the conductor becomes increasingly sealed and successively less permeable to air. Together with the smoothing of the conductor surface, this has a favorable effect on the drag of the individual conductor but has a detrimental effect on the drag of conductors placed on the leeward side due to the progressive development of the increased wind speed caused by the displacement of the air.
The example of the SA 264-AL1/34-A20SA conductor with round-shaped wires shows that a higher preload lowers the drag coefficient in the supercritical to trans critical range from 1.01 to 0.97, which corresponds to a reduction of around 4.0 %. In the critical Reynolds number range, the reduction in drag is even more pronounced at around 6.0 %, Figure 8.
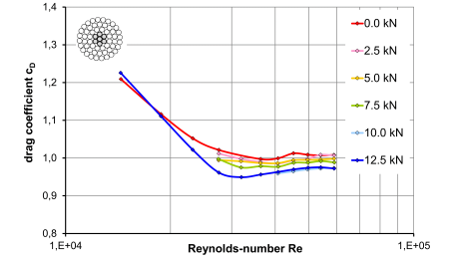
Figure 8 - Drag coefficient of single conductor type SA 264-AL1/34-A20SA as a function of conductor preload in turbulent flow Iv = 4 %
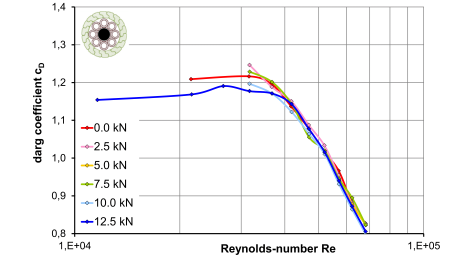
Figure 9 - Drag coefficient of single conductor type SF ACPR Lo-Sag 229-AT1-87-AT/40 with Z-wires as a function of conductor preload in turbulent flow Iv = 4 %
However, these trends do not apply to the same extent to other conductor with Z-shaped wires, such as the SF (Z-shaped wire) type, Figure 9. The SF conductor is characterized by its aerodynamically smooth Z-shaped wires, which makes it virtually airtight regardless of the preload. The drag curves at different preload levels show little difference and are almost identical.
Figure 10 shows a summary of the prestressing effects for some of the conductors studied as an example at maximum Reynolds number. With the exception of the Z-wire conductor SF, which has the smoothest surface of all the samples and is still in the critical flow regime, the round wire conductors are assigned to the supercritical flow regime. Furthermore, the so-called star-wire conductor SI exceeds the drag typical for the other conductors due to its rather outstanding surface roughness. It is particularly noticeable that conductor type SE shows a noticeable influence of preloading. Although SE has the same outer dimensions as SG and SH, it differs in the number of wires in the center layer and in the construction of the conductor core. These differences result in a higher air permeability in SE, which is then significantly reduced by increasing the preloading. In addition, pre-stressing conclusively reduces the texture of the round wires and therewith the aerodynamic drag. On the other hand, SG and SH conductors already have a lower air permeability in the unstressed state, so that preloading has a much smaller effect on the drag.
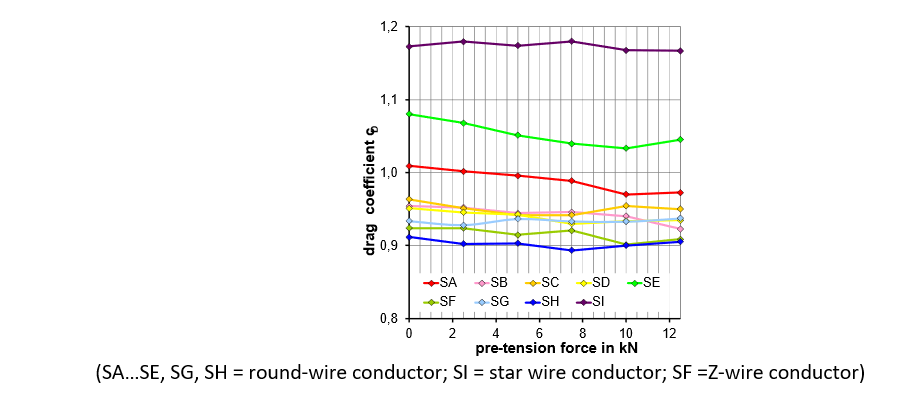
Figure 10 - Effect of preload on the drag at maximum Reynolds number in turbulent flow Iv = 4%
4.4. Wind effects on quad-bundle
Conductor bundles are used in high-voltage transmission networks to increase transmission efficiency and minimize losses due to corona discharges. The individual conductors in these bundles are fixed by means of spacers designed to ensure uniform spacing between the conductors. The present study focuses on analyzing the wind loads on conductor in a quad bundle configuration. The bundle width has been varied between 200 - 400 mm, i.e. with a corresponding spacing dimension of approximately s/d ≈ 7.7 … 15.4. In the wind tunnel measurements, the total wind forces of all four conductors are recorded both in the longitudinal direction (cD) and in the transverse direction (cL) and distributed to the individual conductors by calculation. The cross-wind component, cL, is negligible despite an asymmetric flow around the conductor under oblique wind incidence and is not considered in this case. Measurements are made at different angles of wind incidence to the horizontal, which are set in the wind tunnel by rotating the conductor bundle around the axis.
In a quad bundle, only the two front conductors facing the wind are exposed to the full wind speed at a horizontal angle of incidence of Φ = 0°. The conductors behind, above and below are shielded by the two in front, which means that the respective wind force on the two leeward conductors is lower than on a single conductor in an undisturbed flow. This interaction is known as interference and can be found in many practical construction situations, such as industrial or residential buildings.
In Figure 11,a laser light-sheet technique with a high-speed camera is used to visualize the flow across a conductor bundle in an oblique flow, where the wind is inclined at 20° to the horizontal from below. By means of smoke filaments the deflection of the uniform upstream flow close to the conductor bundle is shown. And in the wake flow is distorted by random fluctuations of local wind velocity and wind direction due to the presence of the near wake turbulence. Already within the bundle regular vortices arise forming the well-known Kármán street.
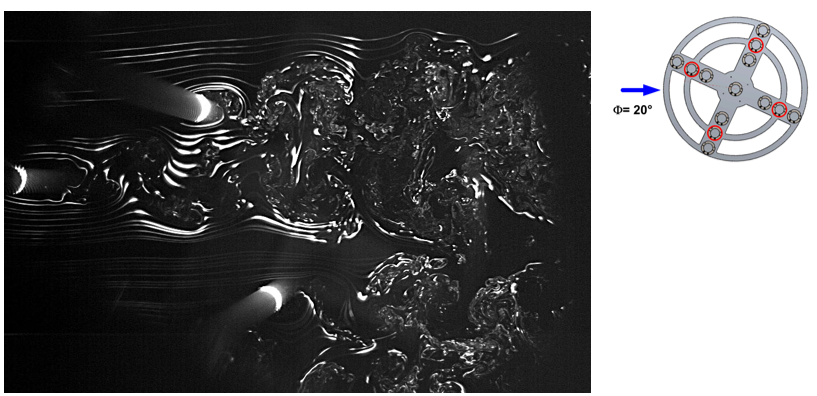
Figure 11 - Visualization of the flow conditions on a quad-bundle under oblique wind incidence (the conductors are brightly illuminated; the bottom conductor is outside the field of view)
The shielding effect of the windward conductor in the bundle reduces the wind load on the downstream conductor at a given angle of wind incidence. Its wind force is then typically lower than that of a single conductor in free flow. All four conductors combined to a bundle, the total wind force of the bundle is usually less than the sum of the wind forces from four individual conductors.
However, depending on how the airflow is directed from the conductors facing the wind to the conductors facing away from the wind, the interference effect between the conductors can also be reversed, resulting in an increased wind force on the leeward conductor. The effects of shielding and displacement vary with the angle of attack of the wind, the distance between the conductors in the bundle and the Reynolds number, which characterizes the flow dynamics around the conductors. The turbulence state of the airflow must also be considered.
Figure 12 to Figure 15 show the drag coefficients of different conductor types in a quad bundle arrangement with a spacing of 300 mm, both in horizontal (Φ = 0°) and with an angle of attack (Φ = 45°) in low-turbulence and turbulent flow. The investigations make it clear that the flow interference in horizontal wind leads to a significant reduction in wind force in every scenario compared to the load on a single conductor in undisturbed free flow. Despite this reduction, the characteristic drag curve of the conductors remains the same; in particular, the curve of the conductor with round-shaped wires S3 differs markedly from that of the conductors with Z-shaped wires. Within the conductors with Z-shaped wires, there is a range of variation in the critical Reynolds regime, with S7 having the relatively highest wind drag and S9 the relatively lowest.
The differences in the drag curves between the Z-shaped conductors are due to the different wind permeabilities, which are individually adjusted depending on, for example, the number of layers with Z-shaped wires and the shape of the Z-wires as well as the proportion of cavities in the core, etc.
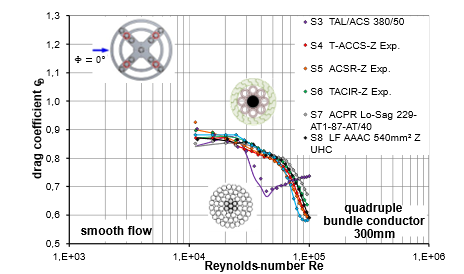
Figure 12 - Drag of leeward conductors in quad bundle in low turbulence flow at angle of attack Φ = 0° (horizontal wind), bundle width s = 300 mm
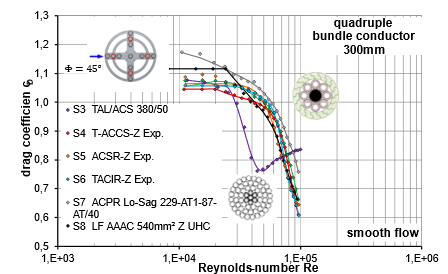
Figure 13 - Drag of leeward conductors in a quad bundle in a low-turbulence flow at an angle of attack of Φ = 45° (diagonal wind), bundle width s = 300 mm
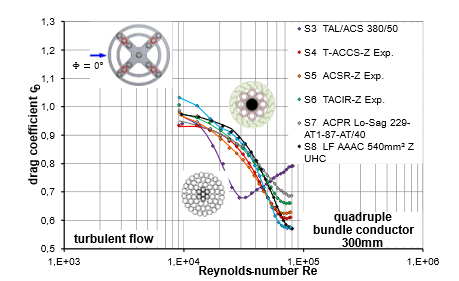
Figure 14 - Drag of leeward conductors in the quad bundle in turbulent flow with angle of attack Φ = 0° (horizontal wind), bundle width s = 300 mm
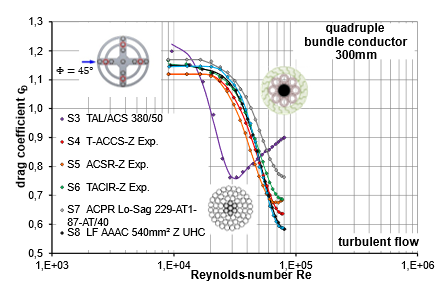
Figure 15 - Drag of leeward conductors in a quad bundle in turbulent flow with angle of attack Φ = 45° (diagonal wind), bundle width s = 300 mm
4.5. Interference factors for the wind force of a quad bundle
The interference factor κ is introduced to determine the shielding or displacement effects on the wind force of conductors in a bundle arrangement. It can be easily determined from the measured force coefficients of the conductors in a bundle CD bundle and the force coefficient of the single conductor CD,single:
(3)
In addition to the angle Φ of attack of the wind on the bundle, the interference factor depends on the Reynolds number and the turbulence level of the flow and, within limits, on the bundle spacing s/D. The analyses have shown that the influence of the Reynolds number can be practically determined in three intervals. The interval limits were defined as a function of the degree of turbulence of the wind tunnel flow.
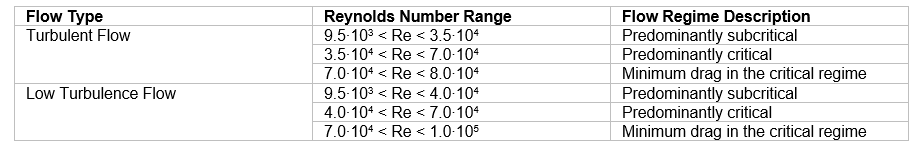
Table 4 - Interval limits of the interference factor for turbulent and low turbulent flow
For the conductor with Z-shaped wires, the three Reynolds number intervals include predominantly subcritical and predominantly critical flow conditions, as well as a range around the critical minimum resistance. For the S3 conductor with round-shaped wires, the three Reynolds number intervals are classified in ascending order as critical and in two stages as supercritical. For each interval, the respective interference factor is then determined for each Reynolds number included and the average for the relevant Reynolds number interval is formed.
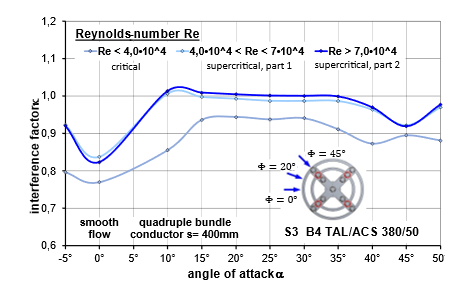
Figure 16 - Interference factor for conductor type S3: TAL/ACS 380/50 depending on angle of wind incidence, low turbulence flow, low preload FV = 2.5 kN, bundle width s = 400 mm
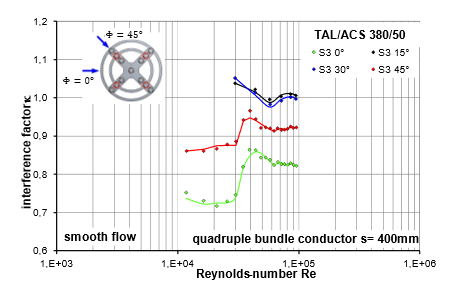
Figure 17 - Interference factor to conductor type S3: TAL/ACS 380/50 depending on Reynold number low-turbulence flow, low preload FV = 2.5 kN, bundle width s = 400 mm
Very similar results can be observed in turbulent flow, Figure 18 and Figure 19.
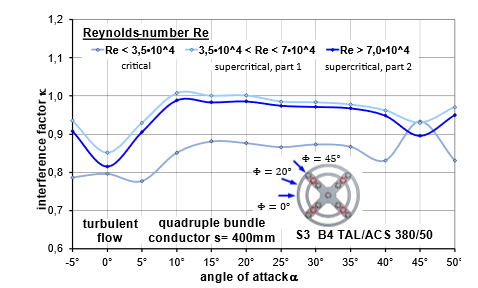
Figure 18 - Interference factor for conductor type S3: TAL/ACS 380/50 depending on wind angle of incidence turbulent flow, low preload FV = 2.5 kN, bundle width s = 400 mm
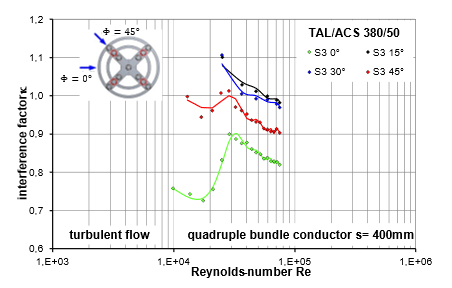
Figure 19 - Interference factor for conductor type S3: TAL/ACS 380/50 depending on Reynold number turbulent flow, low preload FV = 2.5 kN, bundle width s = 400 mm
Figure 20 and Figure 21 show that the preload has only a marginal influence in this context, using the example of the SA and SB conductors. Figure 20 and Figure 21 demonstrate that spacing between sub-conductors exhibits significance at equivalent stressing conditions. A reduced sub-conductor spacing leads to increased shielding effects, resulting in a reduction of the shielding factor κ. Due to the bundle's rotation and total deflection, wind effects cannot be determined solely from shielding effects.
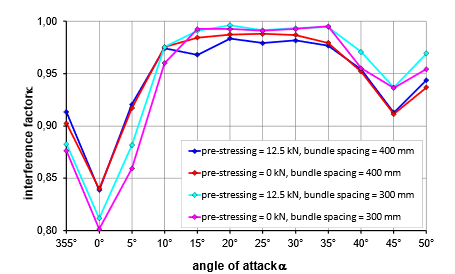
Figure 20 - Interference factor κ for the longitudinal wind force in a quad-bundle type SA 264-AL1/34-A20SA (round-wire) as a function of the angle of wind incidence and preload; turbulent flow, bundle spacing s = 300 and 400 mm, s/d= 13.4 and 17.8, Remax = 5.87·104, supercritical flow regime
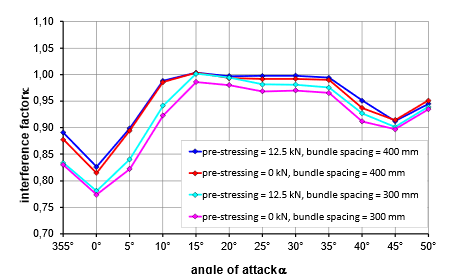
Figure 21 - Interference factor κ for the longitudinal wind force in a quad-bundle SB: 553-AL1/71-A20SA (round-wire) as a function of the angle of wind incidence and preload turbulent flow, bundle spacing s = 300 and 400 mm, s/d= 9.2 and 12.3 Remax = 8.42·104, supercritical flow regime
The transfer of insights from shading effects to practical applications cannot be carried out. Rather, further investigations are required so that these insights can be transferred to a holistic span field.
5. Conclusion
The new functions for the drag coefficient of conductors are used as part of probabilistic calculations for the existing grid. It is exceedingly important to combine these calculations with an analysis of the wind conditions at the site of the pylon. This takes into account the actual characteristics of the line, such as topography, ground roughness, height of the conductor above the ground level or the type of bundle [19].
This holistic analysis of the wind conditions, combined with the basic studies of the conductor's drag, provides an accurate and optimized understanding of the wind effects on the conductor at the site. The exact wind properties can then be used as the basis for calculating the drag coefficients. This can be used to optimize both the mechanical and electrical design. This approach ensures a more accurate assessment of wind loads, leading to more reliable and economical design solutions for the transmission grid.
The present study shows that conductors with Z-shaped wires in the outer layers have significantly more favorable aerodynamic properties at high Reynolds numbers than those with round-shaped wires. Due to their smooth and interlocking construction, conductors with Z-shaped wires have significantly lower drag coefficients, which is particularly beneficial in turbulent flow conditions. In contrast, conductors with round-shaped wires have higher drag coefficients due to their rougher surface, but can contribute to effective wind load reduction in bundled arrangements.
A key finding is that conductors with Z-shaped wires enter the critical Reynolds number range at higher wind speeds, thereby reducing drag later. At very high Reynolds numbers, the drag coefficient stabilizes, conductors with Z-shaped wires maintaining consistently lower values.
Another key finding is that although conductor with Z-stranded wires only show the critical Reynolds numbers at higher wind speeds, they then provide a lower drag compared to conductor with round-stranded wires in the range relevant to design. This is the particular advantage of the conductor with Z-stranded wires, which becomes clear in a fully probabilistic reliability analysis with a more favorable design outcome. In quad bundle configuration, the front conductors provide significant shielding for the rear conductors, reducing the overall wind load. The study varied the spacing between the conductors (300 and 400 mm) and found that a smaller spacing increased the shielding effect, particularly for conductors with round-shaped wires. The shielding effects cannot be directly used to calculate the wind effect, as this depends on both the rotation of the bundle and the total deflection.
The preload of the conductors also plays an important role. Higher preload results in a smoothing of the conductor surface, which reduces drag. Understanding the impact of preload on the conductors provides insights into the test setup and thus validates it. This effect is more pronounced for conductors with round-shaped wires, while conductors with Z-shaped wires are less sensitive to changes in preload due to their closed construction.
These results suggest that the drag coefficients used in the current DIN EN standards may be too conservative. Adjusting the design standards could lead to more accurate and potentially lower wind load estimates, optimizing the design and reducing the cost of transmission line towers. The reduced drag coefficients at high wind speeds also promote a probabilistic approach to wind load assessment that takes into account the specific aerodynamic properties of modern conductor designs.
The investigations also show that both the Reynolds number, which is related to wind speed, and the degree of turbulence of the wind simulated in the wind tunnel strongly influence the wind drag coefficient of single and quad bundle conductors. These findings are particularly important for site based probabilistic calculations of overhead lines, as they allow for the efficient use of load reserves depending on the site. The investigation of the shielding effects of bundled conductors and their influence on the calculations should be further analyzed as a future research topic. In any case, it is recommended that the overall assessment of the aerodynamic properties of a conductor should include its behavior as a single conductor and in a bundle of four. A conductor may be aerodynamically unfavorable as a single conductor but offer aerodynamic advantages in a bundle arrangement. However, it should be noted that national standards, such as [1] do not specify different parameters for bundled conductors. Instead, when calculating forces on bundle conductors, the values of single conductors are applied without considering any shielding effects
References
- DIN EN 50341-2-4 VDE 0210-2-4:2016-04 - Freileitungen über AC 1 kV - Teil 2-4: Nationale Normative Festlegungen (NNA) für Deutschland (basierend auf EN 50341-1:2012); Deutsche Fassung EN 50341-2-4:2016.
- ASCE Manuals and Reports on Engineering Practice No. 74, Guidelines for Electrical Transmission Line Structural Loading,Third Edition, ASCE, Reston, USA, 2010.
- S. Houle, C. Hardy, and E. Ghannoum, "Static and Dynamic Testing of Transmission Lines Subjected to Real Wind Conditions," presented at the Symposium Leningrad 1991, CIGRE, Paper S 33-91, June 1991.
- DIN EN 1991-1-4:2010-12 Eurocode 1: Einwirkungen auf Tragwerke – Teil 1-4: Allgemeine Einwirkungen, Windlasten, Deutsche Fassung EN 1991-1-4:2010, Deutsches Institut für Normung e.V., Dez. 2010..
- DIN EN 1991-1-4/NA 1:2010-10 Nationaler Anhang – National festgelegte Parameter – Eurocode 1:Einwirkungen auf Tragwerke – Teil 1-4: Allgemeine Einwirkungen – Windlasten, Dez. 2010..
- ISO 4354:2009, Wind actions on structures, International Organization for Standardization, Juni 2009.
- Niemann, H.-J., & Hölscher, N. (1990). A review of recent experiments on the flow past circular cylinders. Journal of Wind Engineering and Industrial Aerodynamics, 33(1-2), 197-209.
- DIN EN 50182:2001-12 Leiter für Freileitungen – Leiter aus konzentrisch verseilten runden Drähten; Deutsche Fassung EN 50182:2001.
- IEC TR 61597:2021-06 Overhead eletrical conductors – Calculation methods for stranded bare conductors.
- DIN EN 62219:2003-01 Leiter für elektrische Freileitungen – Leiter aus Formdrähten mit konzentrisch verseilten Lagen; Deutsche Fassung EN 62219:2002.
- Noise-reducing conductors for reconductoring projects: system development and pilot installation; CIGRE Paris Session 2024; Unterfinger, Steevens, Riebling, Möllenbeck, Schröder - ref. B2-11132-2024.
- DIN EN 50341-1: 2013-11 (VDE 0210-1) Freileitungen über AC 1 kV – Teil 1: Allgemeine Anforderungen – Gemeinsame Festlegungen; Deutsche Fassung EN 50341-1:2012.
- CIGRE TB 324 – Sag-Tension Calculation Methods for Overhead Lines; 2007-06.
- IEC 61395:1998-03 Overhead electrical conductors – creep test procedures for stranded conductors.
- ESDU 80025 Engineering Sciences Data Unit International: Mean forces, pressures and flow field velocities for circular cylindrical structures: single cylinder with two-dimensional flow, The Royal Aeronautical Society, The Institution of Structural Enginee.
- Schewe, G. (1983). On the force fluctuations acting on a circular cylinder in cross-flow from subcritical up to transcritical Reynolds numbers. Journal of Fluid Mechanics, 133, 265-285..
- Electric Power Research Institute, Wind Tunnel Study of Drag Coefficients of Single and Bundled Conductors, Final Report, December 1997, USA.
- Freileitungen – Planung, Berechnung und Ausführung, Friedrich Kießling, Peter Nefzger, Ulf Kaintzyk [online]
- VDE-AR-N 4210-4:2014-08 Anforderungen an die Zuverlässigkeit bestehender Stützpunkte von Freileitungen, Verband der Elektrotechnik Elektronik Informationstechnik e.V., August 2014.