B2 - Potential Wildfire-induced Tripping Section Assessment of Transmission Line Based on Tree Identification and Flame Combustion
Authors
Linmeng FAN, Enze ZHOU, Lei WANG - Electric Power Research Institute, Southern Power Grid Co., Ltd., China
You ZHOU - Changsha University of Science and Technology, China

Summary
In recent years, the rise in global temperatures caused by climate change has bring an increase in severe weather events, leading to a significant surge in wildfires along transmission corridors. The wildfires, characterized by high temperatures and ash, pose a serious threat to the air gap insulation, and can even trigger tripping failures of transmission lines. Past studies have focused on aspects such as risk distribution assessment of wildfire, with little attention paid to the wildfire-induced tripping risk of transmission lines. Considering the flame conditions and combustion products differ with different vegetation types, thereby affecting the extent of insulation degradation in transmission lines. To carry out differentiated measures for wildfire prevention, this paper proposes a method for evaluating the potential tripping sections in transmission lines based on tree identification and flame combustion model.
Firstly, the structure parameters of transmission line and the underlying surface information of transmission corridor are extracted from laser point cloud data. After extracting vegetation areas based on object-oriented classification technique, typical species of trees are identified based on multispectral image data. Based on the species and height of trees, the fuel load of the underlying surface is calculated. And the Wang Zhengfei model is employed to estimate the combustion parameters, including maximum height and temperature of flame in the event of a wildfire occurs on the underlying surface of the transmission section.
According to the height relationship between flame and transmission line, the flame bridging of the air gap is classified into two different scenarios: Flame bridges entirety of air gap, and Flame bridges part of air gap. Based on the vegetation types and flame bridging scenarios, the possible wildfire-induced breakdown strength of air gap is evaluated by using the flame breakdown model. And the wildfireinduced tripping risk for the transmission line is then obtained by comparing the maximum operating voltage with the wildfire-induced breakdown voltage.
Finally, the wildfire-induced tripping risk of transmission line is categorized into different risk levels based on the risk values. A risk section distribution map is created, highlighting possible tripping sections, thus serving as a basis for wildfire prevention and control in the power grid.
The proposed method has been applied to the important transmission corridors in the Southern Power Grid, enabling a comprehensive assessment of wildfire-induced breakdown risk. The drawn wildfireinduced tripping risk section distribution map guides differentiated wildfire operation and maintenance activities in critical transmission line corridors.
Keywords
Wildfire, Transmission line, Tripping risk, Flame, Breakdown voltage, Air insulation gap, Fume1. Introduction
In recent years, wildfires have occurred frequently as a result of the unusual global climate and the flourishing of fire practices such as burning and rituals in China. When wildfires spread into the vicinity of transmission lines, there is a heightened risk of tripping occurring due to the significant reduction in air insulation between the ground and transmission lines caused by high temperatures, the conductivity of flames, and the combustion by-products[1]. On February 5th, 2021, a wildfire occurred along the transmission corridor of the 500kV Laiwu-I line in Guangxi province, leading to multiple tripping instances in quick succession. Consequently, wildfires have emerged as a prominent cause for tripping failures in transmission lines, significantly impacting the safe and stable operation of power grids [2]. Evaluating the wildfire-induced tripping risk of transmission lines benefits the development of differentiated wildfire-prevent measures for power grids.
Early in 1970s, Canada firstly proposed the Fire Weather Index (FWI) to assess the risk of wildfires. After that, countries successively proposed their own wildfire risk assessment methods, such as Australia’s Index of Forest Fire Danger (IFFD), Russia's Nesterov Index (IN) index and China's Forest Fire-Danger Weather Ratings. These methods can only assess the risk distribution of large-scale wildfires in forests rather than the tripping risk of transmission lines [3-5]. Zhu used 12 risk factors, encompassing the climate and the fire danger level, aimed at early warning of wildfire-induced tripping for transmission lines [6]. Liu proposed a tripping risk model of transmission line based on gas discharge theory [7]. However, the combustibility of vegetation introduces a critical variable, as the type of flora affects both the scale of the flame and the associated by-products. This, in turn, exerts a discernible influence on the reduction of the withstand voltage of insulation in transmission line [8,9]. CIGRE WG B2.45 TB 767 provides a detailed account of line tripping incidents caused by wildfires in recent years in typical regions of South Africa and the Mediterranean. It analyzes the critical conditions for arc initiation in line insulation under wildfire conditions[10]. However, the voltage level of transmission lines, insulation structures, and the burning conditions of wildfires all influence the magnitude of leakage current in line insulation, making it difficult to use this model to guide on-site risk assessment.
This paper proposes a novel approach to assess wildfire-induced tripping risk on transmission lines based on tree identification and flame combustion models. The basic process is shown in Figure 1. Firstly, laser point cloud data is used to extract the structure parameters and topographic features in transmission corridor. Specifically, the identification of vegetation types is accomplished through object-oriented and pixel-based approaches based on multispectral images. Then Wang Zhengfei model is employed to estimate the combustion parameters of the wildfire associated with wildfires occurring in sections of the transmission corridor. According to the heights of flame and transmission line, the pattens of flame bridging air gap are divided into different scenario. Considering the degradation of air insulation, the wildfire-induced breakdown voltage of insulation in the transmission line is calculated. By comparing the maximum operating voltage and the wildfire-induced breakdown voltage of the transmission line, the wildfire-induced tripping risk value of the transmission line section is evaluated.
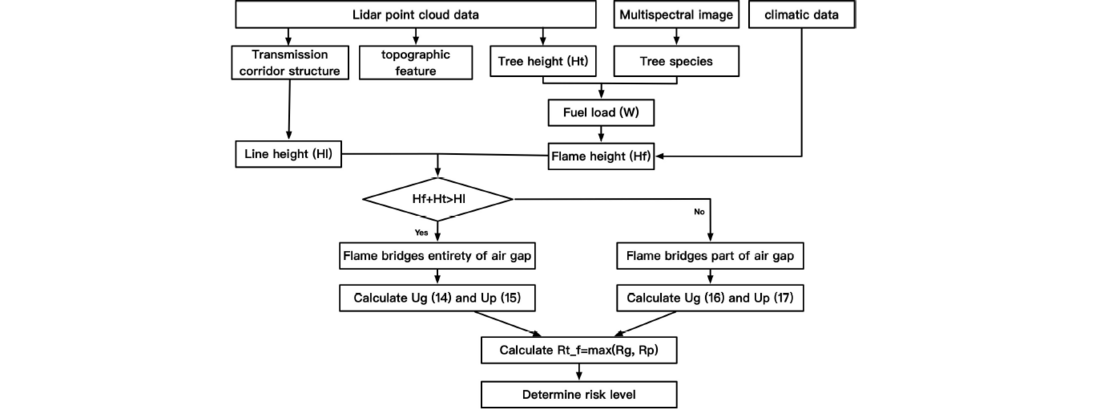
Figure 1 - Basic process of wildfire-induced tripping section Assessment
2. Transmission channel feature extraction and tree species identification
The essence of evaluating wildfire-induced tripping risks on transmission lines lies in obtaining crucial feature parameters along transmission corridors. This study utilizes Unmanned Aerial Vehicles (UAVs) equipped with LIDAR and multispectral cameras for rapid scanning. The LIDAR and multispectral image data are then employed to identify transmission channel and tree species parameters, enabling the computation of flame combustion parameters and assessment of wildfire-induced tripping risks on the transmission line. This integration of advanced technologies streamlines the evaluation process, ensuring a quick and precise analysis of transmission corridor features.
2.1. LiDAR point cloud data processing for transmission corridors
LiDAR, renowned for its precision and resolution, plays a pivotal role in target detection. However, excessive resolution of LiDAR point cloud data poses processing inefficiencies. To address this, the initial data undergoes procedures of noise reduction and thinning for computational efficiency. Subsequently, it is refined using the Adaptive TIN (ATIN) algorithm, followed by the application of the Bowyer-Watson algorithm for Delaunay triangular mesh construction, elucidating the ground structure [11,12]. The derived ground structure is then interpolated to form the Digital Elevation Model (DEM), facilitating the calculation of surface features like slope and aspect. The typical data processing process of LiDAR point cloud for a transmission corridor, as shown in Figure 2.

(a) Raw point cloud data; (b) Filtered data; (c) Delaunay triangular mesh construction; (d)Final DEM
Figure 2 - Typical data processing process of LiDAR point cloud
2.2. Multispectral image-based Identification of subsurface types and tree species
The combustion characteristics, including flame strength and smoke by-products, are influenced by the tree species, subsequently impacting the breakdown strength of transmission line insulation. This study focuses on rapid identification of tree species in transmission corridor underlays, employing object-oriented and pixel-based classification methods on multispectral UAV-captured image data. The initial object-oriented classification utilizes NDVI data to distinguish vegetation from nonvegetation areas.
Based on our experiences, the segmentation parameters, with a scale factor of 200, shape factor of 0.4, and tightness factor of 0.5, can effectively preserved the contour of vegetation at the vegetation and non-vegetation edge, as shown in Figure 3.
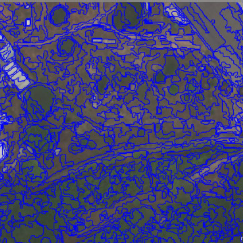
Figure 3 - The segmentation result of vegetation and non-vegetation region.
During the second stage, the feature data of six bands (blue, green, red, red-edge, red-edge 750, and near-infrared) in vegetation regions are used. The feature includes spectral features, texture GLCM (Grey-Level Co-occurrence Matrix) features, and DSM (Digital Surface Model) feature, as listed in Table 1. With a scale factor of 150, shape factor ratio of 0.7, and tightness factor of 0.6, the initial tree species of grassland, bamboo, and other forested areas can be then classified.
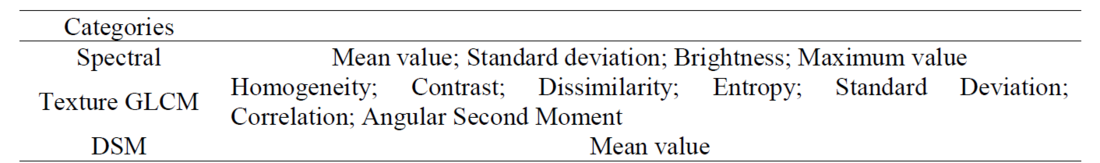
Table 1 - The used segmentation feature in stage 2
For future tree species identification, a machine learning method based on maximum likelihood estimation is employed on the multispectral image data. Initially, an extensive set of tree image samples, encompassing all pixels across six spectra, is meticulously labeled to construct a training set. Subsequently, probability density functions of multi-dimensional Gaussian distributions for distinct tree species are trained by utilizing the maximum likelihood method. Once the model is formulated, the Bayesian is applied to compute the category probability of unknown samples. Typical classification results for tree species are shown in Figure 4.
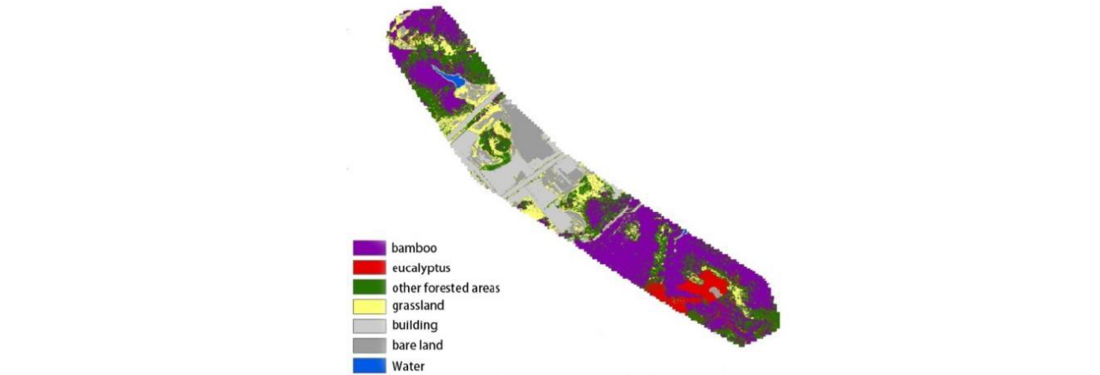
Figure 4 - Typical results of tree species classification
2.3. Fuel load calculation based on tree species
In the case of a wildfire beneath a transmission line, flame size correlates closely with the fuel load of the underlay. This study estimates the fuel load based on the species and the height of trees or vegetables on the subsurface, which were derived through fitting epxerimental data[13-17]. For grass underlay, the fuel load Wgrass is contingent on grass type. Short grass dictates a load of 4.025 t/hm2 whereas long grass necessitates 8.05 t/hm2. In the case of bush underlay, the fuel load Wbush is determined by the height of the bush
(1)
where Hbush is the height of the bush, m.
The fuel load of forest, denoted as Wforest , is contingent upon the tree species in the underlay.
Specifically, for typical pine trees
(2)
For cedar trees
(3)
For eucalyptus trees
(4)
where Ybd is the canopy density of the forest, signifying the ratio of the tree crown width to the total forest area. For dense, medium, and sparse canopies, it is assigned values of 0.85, 0.55, and 0.30, respectively.
2.4. Structure parameter extraction of transmission line based on LiDAR
The structure parameters of transmission line are accurately determined through the precise ranging capabilities of LiDAR. To enhance efficiency, LiDAR point cloud data is extracted for a transmission corridor with a 1 km radius. Considering the clustering characteristics of point cloud data for transmission line, an octree-based algorithm [18] is employed for spatial clustering. This process isolates the transmission line point cloud data, establishing a foundational dataset for subsequent calculations related to transmission corridor information, including phase-to-phase and phase-to canopy distances.
3. Flame characteristics Calculation based on Zhengfei Wang's model
The wildfire spread process, influenced by surface fuels and meteorological factors, is extremely complicated [19]. Flame height directly impacts how the transmission line is bridged by the flames, affecting the risk of insulation breakdown. The Flame height can be evaluated by wildfire spread models. Currently, prominent wildfire spread models include the Rothermel model[20], the McArthur model [21], and the Wang Zhengfei model[22]. The Rothermel model, proposed by the US Forest Service, considers factors such as fuel, weather, and terrain, but its applicability is limited due to the numerous required parameters. Conversely, the McArthur model is relatively simple, but it is based on the burning of typical vegetation in Canada, making it more suitable for predicting small-scale fire behavior in Canada's forests and grasslands. The Wang Zhengfei model is derived from burning experiments on typical vegetation in China and has been widely applied in various wildfire propagation and fire hazard modeling fields in China. Considering the abundance of tall trees such as eucalyptus, pine, and fir in the study area, which exhibit high flame intensity during combustion and pose a significant impact on the insulation of power transmission lines, the use of the Wang Zhengfei model for estimating flame parameters is more appropriate.
In Wang Zhengfei’s model [23], the flame height Hf can be estimated by
(5)
where I is the front-line intensity of flame, representing energy released in time and linear space (W/m·s) during combustion. Its value is determined by the calorific power as well as the fuel load of the combustible materials, and the propagating speed of fire [24,25].
I=0.007QWR (6)
where Q is the calorific power of combustible materials, Cal/g , derived from the tree species of underlying surface (refer to Table 2); W is the fuel load, t/hm², calculating using the method in section 2.3; R is the spreading speed of flame, m/min, which needs to be corrected according to combustible type, the meteorological and terrain conditions.
| Tree species | cedar | grass | bush | eucalyptus | pine |
| Calorific value (Cal/g) | 4587 | 3873 | 4417 | 3900 | 4552 |
(7)
where Kc is fuel coefficient, as shown in Table 3. Kφ is slope coefficient, and Kv is wind speed coefficient.
| Categories | Kc |
|---|---|
| Water, Settlements, Bare ground, Road | 0.0 |
| Arable land | 0.1 |
| Mixed forest | 0.5 |
| Coniferous forest | 1 |
| Grass land | 2 |
(8)
(9)
where φ is terrain slope angle, v is wind speed, R0 is a semi-empirical initial spread of flame in Wang Zhengfei model, which is estimated by equation (10).
R0=0.03T+0.05F-0.01H+0.7 (10)
where T is temperature, F is wind level, H is relative humidity.
4. Wildfire-induced Tripping Section Assessment
In the occurrence of a wildfire within a transmission corridor, the decrease in air insulation may lead to two types of tripping failures in transmission lines: phase-to-ground and phase-to-phase breakdowns.
The tripping risk in this paper is defined as whether the insulation of the transmission line can withstand the maximum voltage of the transmission line during wildfire conditions in the transmission corridor. That is, if the insulation between phases cannot withstand the highest operating line voltage, it may cause a phase-to-phase trip; whereas if the insulation between phase and ground cannot withstand the highest operating phase voltage, it may cause a phase-to-ground trip. Thus, the wildfireinduced tripping risk Rt_f of transmission section is the higher value between the phase-to-ground breakdown risk Rg and the phase-to-phase breakdown risk Rp, as illustrated in equations (11)-(13).
(11)
(12)
(13)
where U is the operating voltage of transmission line; Ug and Up represent the withstand voltage of the air gap for line-to-ground and of line-to-line under wildfire circumstances, respectively.
4.1. Flame scenarios
The impact of a flame on the reduction of air gap insulation is strongly related to the combustion strength [26]. The combustion process engenders substantial charge carriers through thermal ionization and chemical dissociation, resulting in a high conductivity within the bulk of the flame. Once the flame bridges the entire air gap in either phase-to-ground or phase-to-phase, it becomes prone to causing breakdown, triggering a tripping failure. Even in instances where the flame does not completely bridge the air gap, the insulation of the remaining gap is considerably reduced by ash and elevated temperatures in the fume [27]. Therefore, the following two different scenarios are considered based on the relationship between the heights of the flame and the transmission lines.
4.1.1. Flame bridges entirety of air gap
When the height of the flame surpasses that of the transmission line (Figure 5), both insulation of phase-to-ground and phase-to-phase are entirely bridged by the flame. Ignoring the insulation of live trees, whose surface conductivity is generally higher than 0.1 S/m [28], the insulations of the phase-toground and phase-to-phase of the transmission section are all determined by the gap length and the wildfire-induced breakdown field strength of the air.
(14)
(15)
where Hl is the minimum height of the transmission line; Ht is the maximum height of trees at the transmission corridor; dl-t is the minimum length of air gap between transmission line and trees; dp is the minimum length of the air gap between the wires of the transmission line. Ef is the wildfireinduced breakdown field strength of the air. According to the experimental breakdown results of long air gap under flame, Ef is taken as 35 kV/m [29].
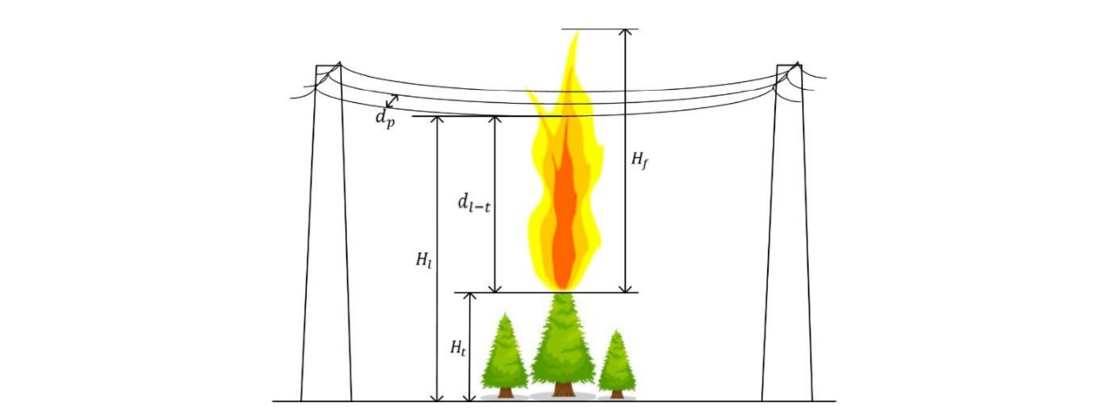
Figure 5 - Flame bridges air gap between lines and trees
4.1.2. Flame bridges part of air gap
When the height of flame is lower than that of the transmission line, the insulation gap for phase-toground encompasses a segment occupied by flames and rest by fumes, as shown in Figure 6. The withstand voltage of phase-to-ground gap is then determined by
(16)
where Hf is the possible height of the flame, which can be evaluated by the Wang Zhengfei model.
And Es is the average breakdown field strength of fume.
Considering the most severe case, the air gaps of phase-to-phase are enveloped by fume. the withstand voltage of the phase-to-phase gap is approximated by
(17)
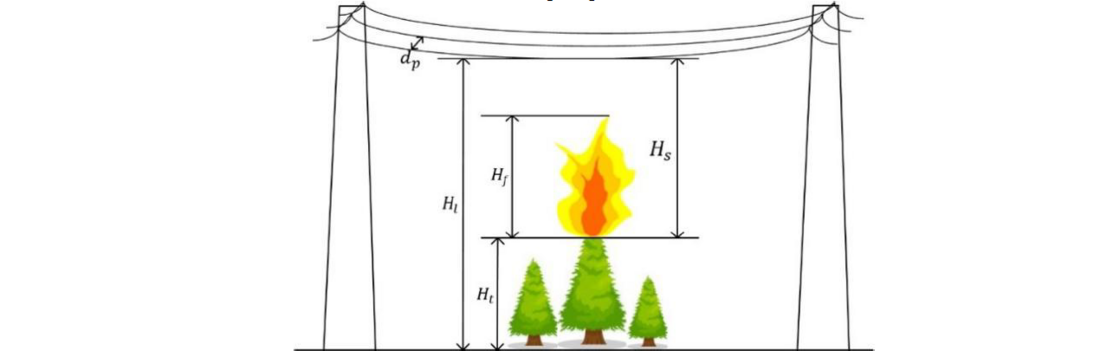
Figure 6 - Flame partially bridges air gap between lines and trees
4.2. Average breakdown field strength of fume
Even in cases where the flame does not bridge the gap, the fumes released from the combustion are highly likely to envelop the space around the wires of transmission lines. The elevated temperature of the flame decreases the density and humidity of the air within the fume, facilitating the development of electron avalanches [30,31]. Simultaneously, particles and ash suspended in the fume drift into the high-electric-field region near the wires, distorting the electric field distribution and prompting discharges. Consequently, to account for variations in density and humidity, a particle coefficient Kp is introduced to modify the breakdown strength of the air gap [27, 32].
(18)
where Es is the average breakdown strength of fume; Ea is the breakdown strength of air gap under standard atmospheric conditions (Temperature: 20 ℃, Humidity: 11 g/m3, Atmospheric pressure: 101.3 kPa). The triggering effect of ash particles on discharge depends on the type of burning vegetation. Experimental results show that the AC breakdown voltage of the air gap, influenced by the ashes and particles released by the combustion of thatch and fir branch, can reduce to approximately 40% of that observed under the standard atmosphere [27]. Therefore, the particle coefficient Kp is taken as 0.4.
The density coefficient Kσ depends on the relative air density in the fume and can be expressed as
(19)
(20)
where m is the correction index, which is associated with electrode shape, gap length, voltage type, and other factor; Pa is the ambient pressure, and Ta is the ambient temperature; Pf represent the changed atmospheric pressure above the flame. Assuming that the heating is a long-term process affecting the air above the flame, the local pressure remains essentially unchanged in open space, that is Pf≈Pa; ΔT is the temperature rise of air in the fumes, estimated by the flame combustion model [33].
(21)
where Hs is the height of the calculated position relative to the canopy. In the case of line-to-ground breakdown, the median height of the flame is considered, that is Hs=Hf+0.5(dl-t+Hf). For the phase-tophase breakdown, the height is taken as Hs=dl-t.
Kh represent the humidity coefficient.
Kh=kw (22)
where w is an exponent parameter, which is related to gap length, electrode shape, voltage type and other factor; k depends on the voltage type and is determined by the ratio of absolute humidity h to the air density σ in the fume. For AC breakdown of air gap, it is obtained by
(23)
To determine the standard breakdown field strength Ea, two different breakdown mechanisms are concerned. For short distance, the breakdown of the air gap is governed by the propagation of streamer. The breakdown field strength Ea is regarded as nearly independent of the gap length, and is assigned a value of 241.39 kV/m. However, with increased gap distance, the electric field around the transmission line creates conditions for the inception and propagation of a continuous leader, which exhibits significantly higher conductivity compared to the streamer [34]. For air gaps exceeding 4 m, the Rizk semi-empirical model [35,36] is employed to determine the breakdown strength, as expressed
in equation (24).
(24)
where ds is the gap length.
5. Case study
The insulation breakdown risks for all transmission line sections above 110kV in the Guizhou Power Grid were computed. For visual representation, the risk values were categorized into four levels, each denoted by distinct colors as outlined in Table 4. The wildfire-related tripping risk levels in the Guizhou Power Grid were distributed as follows: 42.73%, 20.36%, 21.35%, and 15.56% respectively (Figure 7). This signifies that the proposed method adeptly discriminates the wildfire risk distribution along transmission corridors.
| Risk level | Level I | Level II | Level III | Level IV |
| Rt | [0,0.40] | (0.40,0.60] | (0.60,0.80] | (0.80,∞) |
| Representative color | Green | Blue | Yellow | Red |

Figure 7 - Risk level percentages of transmission line section
To further illustrate the method's efficacy, the 220kV Yanwan line is taken as an illustrative case study. This transmission line espans from north to south, traversing the provincial capital city and its adjacent counties, comprising a total of 68 transmission towers. The distribution of risk levels among line sections is as follows: 17.91% for Level I, 38.81% for Level II, 34.33% for Level III, and 8.95% for Level IV (Figure 8). Specifically, line sections associated with the 10th-13th towers and the 26th-29th towers are identified as having a risk level IV. For line sections categorized as risk levels III and IV, it is imperative for the power supply bureau to enhance patrols and monitoring in the vicinity, mitigating the potential impact of wildfires and averting tripping failures.
For line sections classified under risk levels III and IV, it is crucial for the power supply bureau to intensify patrols and monitoring in the vicinity. This proactive approach aims to mitigate the potential impact of wildfires and prevent tripping failures, thereby enhancing the overall reliability of the power transmission system.
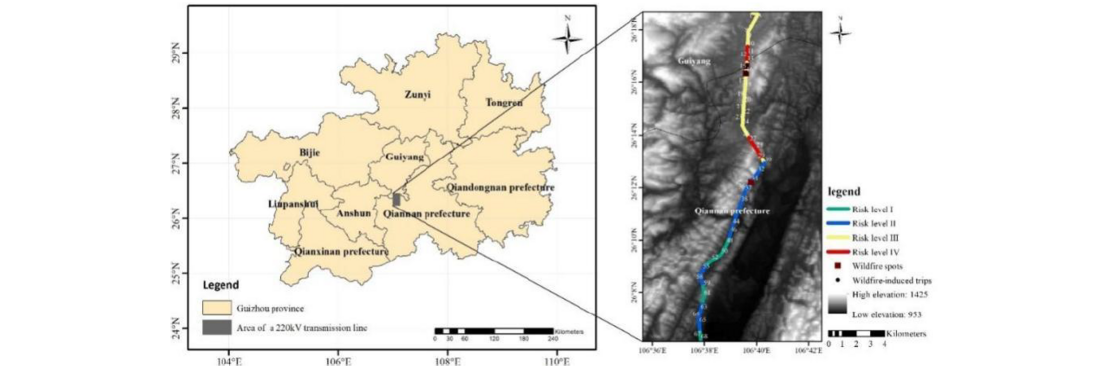
Figure 8 - The location and risk level distribution of a 220kV Yanwan line
In the spring of 2020, two wildfire incidents occurred within the transmission corridor of the Yanwan line. The first incident was monitored around 9:00 a.m. on February 28th within the line section encompassing the 34th-35th towers. Timely intervention by relevant departments led to its extinguishment by approximately 11:00 a.m. The transmission line maintained normal operation during the wildfire occurrence. It attributed to the underlying surface predominantly covered by grass with a low fuel load of 1.25 t/hm2. The ignited grass generated a maximum flame height of only 0.43 meters, resulting in little impact on the insulation of the transmission line. The risk evaluation assigned a wildfire-induced tripping risk of 0.43, categorizing it as a level II risk within this line section.
Subsequently, at 14:00 p.m. on April 15th, another wildfire emerged within the transmission corridor, this time between the 14th and 15th towers. Within two hours, the wildfire swiftly spread to the 16th tower, causing a tripping failure of the transmission line. The intensity of the blaze impeded successful reclosing, leading to a partial power outage that incurred substantial economic losses on the Guizhou power grid. Investigation revealed the presence of oil-bearing coniferous forests beneath the transmission lines in these sections, with a canopy height of 15 meters and a minimal gap distance of 8 meters from the transmission line. The wildfire-induced tripping risk was assessed at 0.65, classifying it as a risk level III.
The correlation between the actual outcomes of the two wildfire incidents and the predicted tripping risks in their respective line sections highlights the efficacy of the proposed method in evaluating and foreseeing wildfire-induced risks within transmission corridors. By using this method, tailored wildfire prevention measures can be implemented beforehand to enhance the power grid's resilience against wildfires.
6. Conclusion
This study introduces a method for evaluating potential wildfire-induced tripping sections in transmission lines by integrating tree species identification and analyzing wildfire-induced insulation breakdown. Employing tree species identification algorithms enables rapid differentiation of subsurface types and associated vegetation in transmission corridors. Subsequently, the type of tree species facilitates a quick estimation of flame height and insulation reduction during a wildfire. The assessment of wildfire-induced tripping risk employs Wang Zhengfei's model and gas discharge theory. Transmission line sections with a risk value exceeding 0.8 are identified as potential tripping sections.
Acknowledgement
We thank China Southern Power Grid Corporation Science and technology projects GDKJXM20222559.
References
- Naido, P., and Swift, D. A. “Large particle initiated breakdown of an atmospheric air gap: relating to AC power line faults caused by sugar cane fires” (8th International Symposium on High Voltage Engineering 1993 pages 81-84).
- Lu, J., Zhou, T., Wu, C., et al. “Fault statistics and analysis of 220kV and above power transmission line in province-level power grid” (High Voltage Engineering, 2016, 42(01), pages 200-207).
- Hoffmann, W., Schroeder W., and B., J. R. “Regional feedbacks among fire, climate, and tropical deforestation” (Journal of Geophysical Re-search: Atmospheres, 2003, 108(23)).
- Niu, R., Zhai PM., and SUN, M. “Review of forest fire danger meteorological index and its construction method” (Meteorological Monthly, 2006, 32(12), pages 3-9).
- Development and structure of the Canadian forest fire weather index system. (Canadian Forestry Service Forestry Technical Report. Canada, 1987).
- Zhu Q, Guo J, Zeng B, et al. “An early-warning evaluation model against mountain fire of transmission line based on analytic hierarchy process” (Electrical Measurement & Instrumentation, 2018, 55(6), pages 71-75).
- Liu Y, Li B, Wu C, et al. “Risk warning technology for the whole process of overhead transmission line trip caused by wildfire” (Natural Hazards, 2021, pages 1-18).
- Lu, J., Guo, J., Yang, L., et al. “Research and Application of Fire Forecasting Model for Electric Transmission Lines Incorporating Meteorological Data and Human Activities” (Mathematical Problems in Engineering, 2016, pages 1-10).
- Shi, S., Yao, C., and Wang, S. “A Model Design for Risk Assessment of Line Tripping Caused by Wildfires” (Sensors, 2018, 18(6), pages 1941).
- WG B2.45 TB 767. “Vegetation fire characteristics and the potential impacts on overhead line performance” (CIGRE, 2019).
- Wioleta Błaszczak-Bąk, Artur Janowski, Waldemar Kamiński, Jacek Rapiński. “Optimization algorithm and filtration using the adaptive TIN model at the stage of initial processing of the ALS point cloud” (Canadian Journal of Remote Sensing, 2012, 37(6)).
- Rebay S. “Efficient Unstructured Mesh Generation by Means of Delaunay Triangulation and Bowyer-Watson Algorithm” (Journal of Computational Physics, 1993, 106(1), pages 125-138).
- Liu M, Yang X, Yang H L, et al. “Investigation and Analysis on Grassland Resources and Fuel Load of Abandoned Land in Jiange Count” (China Herbivore Science, 2023, 43(03):37-41).
- Zhou E Z, Rao Z Q, Liu Q, et al. “Breakdown Characteristics of Conductor⁃plane Gap Under Typical High Risk Vegetation Fire Condition” (High Voltage Apparatus, 2024, 60(03):179-185).
- Li H, Zhou R L, Gao Z L, et al. “Research on the Fuel Load Forecasting Models of Pinus yunnanensis Forest” (Forestry and Environmental Science, 2011, 27(02):30-37).
- Hu H Q. “Predicting Forest Surface Fuel Load by Using Forest Stand Factors” (Scientia Silvae Sinicae, 2005, (05):96-100).
- Zhang G F, Ou W L, Cnen R Y, et al. “Study On the Dynamic Model of Surface Fuel Loading of Chinese fir Plantation” (Journal of Forest and Environment, 2000,(02):133-135).
- Wang M, Tseng Y H. “Automatic Segmentation of Lidar Data into Coplanar Point Clusters Using an Octree-Based Split-and-Merge Algorithm” (Photogrammetric Engineering & Remote Sensing, 2010).
- Benali, A., Ervilha, A. R., Sá, A. C. L., et al. “Deciphering the impact of uncertainty on the accuracy of large wildfire spread simulations” (Science of The Total Environment, 2016, 569, pages 73-85).
- Pyne S J. “Introduction to wildland fire. Fire management in the United States” (Hoboken, USA:John Wiley & Sons, 1984).
- Nobleir I R, Gill A M, Bary G A V. “McArthur's fire-danger meters expressed as equations” (Australian Journal of Ecology, 1980, 5(2):201-203).
- Perry G L W. “Current approaches to modelling the spread of wildland fire a review” (Progress in Physical Geography, 1998(22): 222-245).
- Perry G L W. “Current approaches to modelling the spread of wildland fire a review” (Progress in Physical Geography, 1998, 22, pages 222-245).
- Byram, G. M. “Combustion of forest fuels”. (1959)
- Perry, G. L. W. “Current approaches to modelling the spread of wildland fire: a review” (Progress in Physical Geography-Earth and Environment, 1998, 22(2), pages 222-245).
- You, F., Chen, H., Zhang, L., et al. “Experimental study on flashover of high-voltage transmission lines induced by wood crib fire” (Proceedings of the CSEE, 2011, 31(34), pages 192-197).
- Li, P., Huang, D., and Ruan, J. “Influence of forest fire particles on the breakdown characteristics of air gap” (IEEE Transactions on Dielectrics and Electrical Insulation, 2016, 23, pages 1974-1984).
- Zhou, H., Sun, L., Yang, Y., et al. “Reduction of electric field strength by two species of trees under power transmission lines” (Journal of Forestry Research, 2018, 29, pages 1415-1422).
- Fonseca, J. R., Tan, A. L., Silva, R. P., et al. “Effects of agricultural fires on the performance of overhead transmission lines” (IEEE Transactions on Power Delivery, 1990, 5, pages 687-694).
- Mphale, K. M., Heron, M., Ketlhwaafetse, R., et al. “Interferometric measurement of ionization in a grassfire” (Meteorology and Atmospheric Physics, 2010, 106(3), pages 191-203).
- Sun, T., Zhang, L., Chen, W., et al. “Mountains Forest Fire Spread Simulator Based on Geo- Cellular Automaton Combined With Wang Zhengfei Velocity Model” (IEEE Journal of Selected Topics in Applied Earth Observations and Remote Sensing, 2012, 6(4), pages 1971- 1987).
- High-voltage test techniques-Part 1: General definitions and test requirements. (China Standard Press. China, 2011).
- Heskestad, G. “Dynamics of the Fire Plume” (Physical and Engineering Sciences, 1998, 356(1748), pages 2815-2833).
- Gallimberti, I. “The mechanism of the long spark formation” (Le Journal de Physique Colloques, 1979, 40(C7), pages 193-250).
- Rizk, F. A. M. “A model for switching impulse leader inception and breakdown of long airgaps” (IEEE Transactions on Power Delivery, 1989, 4, pages 596-606).
- Rizk, F. A. M. “Switching impulse strength of air insulation: Leader inception criterion” (IEEE Transactions on Power Delivery, 1989, pages 2187-2195).