B1 - Dynamic Analysis on HVDC Land Cable and Prefabricated Joint under Salt-mine Blasts
Authors
Yang ZHOU, Christian ANDERSSON, Markus SALTZER, Daniel PESTANA, Giampaolo MARTUFI - NKT, Sweden
Martin SPLETTSTÖSSER, Herbert LOBÜSCHER - TransnetBW, Germany
Marc JEROENSE - MJ MarCable Consulting, Sweden

Summary
The SuedLink line starts in Northern Germany where it connects to power from offshore wind farms and to the Nordlink interconnector, which brings hydro power from Norway to Germany. The aim of the project is to establish two central high-voltage direct-current transmission systems (HVDC systems) between north and south Germany. The project comprises a specially engineered solution for the power cable to cross a salt mine, where blasting regularly occurs. In this work a dynamic analysis has been performed in order to evaluate mechanical deformation and estimate potential impact on the electrical performance of the cable system. Specifically, the deformations and the contact pressure changes generated by salt mining blast events on the 525 kV HVDC land cable including a cable joint of a prefabricated type were computed by means of finite element (FE) simulation. Moreover, the impact on the electrical performance was estimated, by considering potential impact on electrical field enhancement as well as electrical withstand. Commercial software suites were used for the FE analysis and for the evaluation of the electric field distribution. The land cables connected by a metallic connector and a rubber joint were assumed to be surrounded by salt, sand or stones. A blasting acceleration signal with peak value of 1210,5 m/s2 and duration of 0,8 ms was measured 10 meters from the explosions. This signal was then used and applied onto the land cables and the joint system during the simulations.
Simulation results showed that: (a) the electrode deformation which might lead to local field enhancement has been calculated to be within the manufacturing tolerances and the calculated fields vary in the range of numerical uncertainties. (b) The influence of the interface breakdown strength by contact pressure variations has been found to be within potential variations of the voltage application margins of a standardized impulse tests, as well as being covered by design within the expected practical interface pressure variations. (c) Forces on the conductor connection within the ferrule are estimated to be at least a factor of 20 below the usual contact pressure. (d) The corresponding axial loads on the screen wires induced has been found to be less than 5% of the yield strength of the material. From the detailed assessment of the most critical case of a 10 m distance blast, it can be concluded that the overall deformations of the cable and joint system are relatively small and will have no major impact on the mechanical and electrical performance of the HVDC cable-joint system.
Keywords
HV Cable Accessories, HVDC Cable, Dynamic Analysis, Finite Element Analysis1. Introduction
The SuedLink line starts in Northern Germany where it connects to power from offshore wind farms and to the Nordlink interconnector, which brings hydro power from Norway to Germany. The aim of the project is to establish two central high-voltage direct-current transmission systems (HVDC systems) between north and south Germany. The project comprises a specially engineered solution for the power cable to cross a salt mine, where blasting regularly occurs.
In this work a dynamic analysis has been performed to evaluate the mechanical response and its potential impact on the performance of a cable and joint system. Hereby the mechanical simulations have been motivated considering the following potential impact of a blast on the cable and joint system. On one hand, resulting mechanical deformation of the electric stress grading elements in the rubber joint body may alter the field distribution inside the insulating elements of the joint system. Consequently, attention was paid on the deformation of the (semiconducting) rubber electrode layers inside the rubber joint body. On the other hand, not only deformation inside the rubber joint body might have an adverse effect on the joint performance, but also deformation of the (physical) interface between the cable core and the rubber joint body. Here, a deformation might result in adverse change of the contact pressure resulting in reduction of the electrical performance, respectively the electrical withstand of this interface. Moreover, pressure changes of the contact surface inside the ferrule may additionally alter the current carrying path of the cable and joint system, leading to an increased contact resistance increasing the heat generation in the contact. Finally, the mechanical load of the screen wires has been addressed.
Specifically, the deformations, the contact pressure changes, and the mechanical load generated by a salt mining blast events on the 525 kV HVDC land cable including the cable joint of a prefabricated type were computed by means of finite element (FE) simulations. Though, the focus of this paper is on the mechanical simulation, providing input to above mentioned considerations and risk estimations, the way forward, as well as the concluding results have been sketched in this publication. However detailed calculations beyond the mechanical are not subject in this publication.
2. Mechanical simulation model
2.1. Geometry, material properties
For the simulation and analysis, simplifications were made to the geometry of the 525 kV HVDC land cable including a prefabricated cable joint. Minor components and parts which have no significant contributions to the overall structural dynamic responses of the cable and joint were omitted. The simplified geometrical model is sketched in Figure 1.
Isotropic linear elastic materials have been used to model the mechanical properties of the components of the cable and the joint. The material properties of the individual parts inside the 525 kV prefabricated joint, the connector, the cross-linked polyethylene insulation including screens (XLPE) and the copper conductor have been defined based on internal measurements and test data.
Figure 1 – 3D CAD Geometry (half longitudinal section view). Irrelevant internal structures are not resolved
Finite element (FE) models were prepared and simulated using a commercial FE solver , where 8-node brick elements (C3D8R) were used to mesh the cable and joint, while 2-node beam elements (B31) were used for screen wires.
2.2. Boundary condition and blast loads
The land cables connected by the metallic connector and the prefabricated joint were assumed to be surrounded by salt, sand, or stones, as illustrated in Figure 2. Fixed boundary conditions were applied to the far ends of the cables, where all degrees of freedom were constrained. Blast loads were applied onto the land cables and joint system in terms of accelerations.
Figure 2 – Simulated scenario
An expert company used a combination of geophones with different sensitivity and accelerometers to measure the acceleration signal onsite on three axes during a blast event 10 meters away from the blasting location (see Figure 3). For the following investigation, the most severe part of the signal, leading to the worst-case loading condition has been simulated. The right hand side of Figure 3 shows this part of the signal, which has been used as loading condition for a blast located 10 m away from the cable. The measured peak acceleration is 1210,5 m/s2 and its duration is 0,8 ms.
Figure 3 – Accelerations of blasts measured at 10 m distance
3. Results mechanical simulation and impact consideration
This section presents the results of the FE simulations for the dynamic mechanical responses of the cable and joint system when subjected to salt-mine blasts. As mentioned above it is motivated by the potential impact on the cable and joint system performance, where for the latter only the way forward as well as some concluding result are presented.
The mechanical simulations were performed for the response in the time intervals around the point where the accelerations reach their peak values, i.e., to capture the most critical response of the cable and joint system.
It should be noted that in the present simulation model, the initial over-pressure at the interfaces between the cables/connector and the joint was not considered. The effects of the initial over-pressure at the interfaces, e.g., the overall contact pressure calculation, was added after.
This loading condition represents the worst-case scenario, with i.e., peak acceleration of 1210,5 m/s2 and a duration of 0,8 ms.
3.1. Deformation of the rubber body
The time evolution of the maximum strain and the corresponding spatial distribution of the maximum strain levels in the joint are depicted in Figure 4. The largest strain (compression) in the joint was approximately 0,004 and located at the inner deflector.
Figure 4 – Max. strain with respect to time (left), max. log-strain in joint (right)
The region with the largest magnitude of displacement in the joint was found at the inner deflector, specifically the maximum was approximately 0,3 mm, located at the inner surface of the inner deflector, as shown in Figure 5.
Figure 5 – Max. magnitude of displacement in joint [m]
The mechanical deformation at the inner deflector may alter the field distribution inside the insulating layer of the joint system. From that perspective a relevant measure, is then the distortion at the outer surface of the inner stress grading deflector of the joint body. The maximal relevant deformation for electric field impact is at the surface of the inner deflector, where simulations predicted a maximal relevant displacement of 0,2 mm. Generally, 0,2 mm is below the allowed manufacturing tolerances and therefore the impact of the deformation is found to not impact beyond manufacturing variation specifications. The deformation pattern is sketched in Figure 6.
Figure 6 – Sketch of the deformation pattern of the surface of the inner deflector
For evaluating relative changes in the electrical field distribution, Urel = (Udeformed - Uundeformed)/ Uundeformed for the nominal voltage has been calculated. Those simulation follow the principle as e.g., in [2] and are not of focus in this publication. The calculated relative change Urel has been found to be below numerical sensitivity, i.e., below 1% (within 0,2 %), Figure 7.
Figure 7 – Relative displacement at the surface of the inner deflector following the calculated deformation sketched in Figure 6. (Axis rotated)
3.2. Contact pressure changes and impact on altered breakdown strength
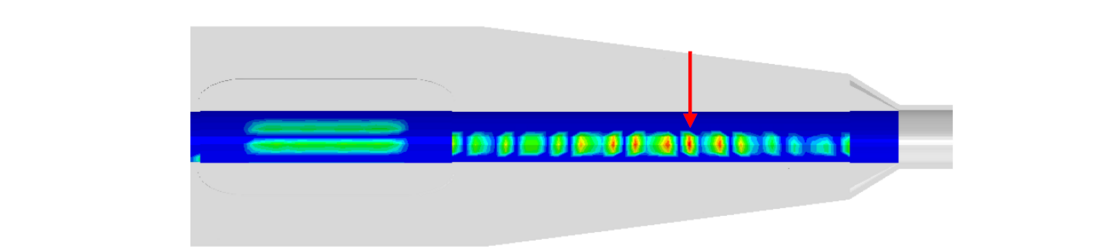
The evolution of the maximum contact pressure in the XLPE/cable-joint interface is observed roughly in the middle of the joint active area. The largest changes of contact pressure simulated were approximately 18 kPa. The location and the changes with respect to time is shown in Figure 8. The contact pressure change at the inner deflector as well as the outer deflector / semicon edge region is well below 10 kPa. Those regions are typically considered the most critical due to the highest occurring electrical stress.
Figure 8 – Contact pressure changes at field grading material (FGM) with respect to time (top picture) at the location with maximum contact pressure, indicated by the red arrow in the bottom picture
To estimate the impact of a pressure variation of approximately 18 kPa, we used results from literature [2] as well as inhouse performed interface pressure measurements.
Citing data from [2] visualized in Figure 9, a ball-park figure of less than 0,2 kV/mm resulting change in breakdown strength is indicated, for an interface pressure change of roughly 20 kPa. Given that the general design pressure is high enough (i.e., larger than 40 kPa in Figure 9). Variations of 0,2 kV/mm are in principle covered by voltage application margins within a TT (DC, SI).
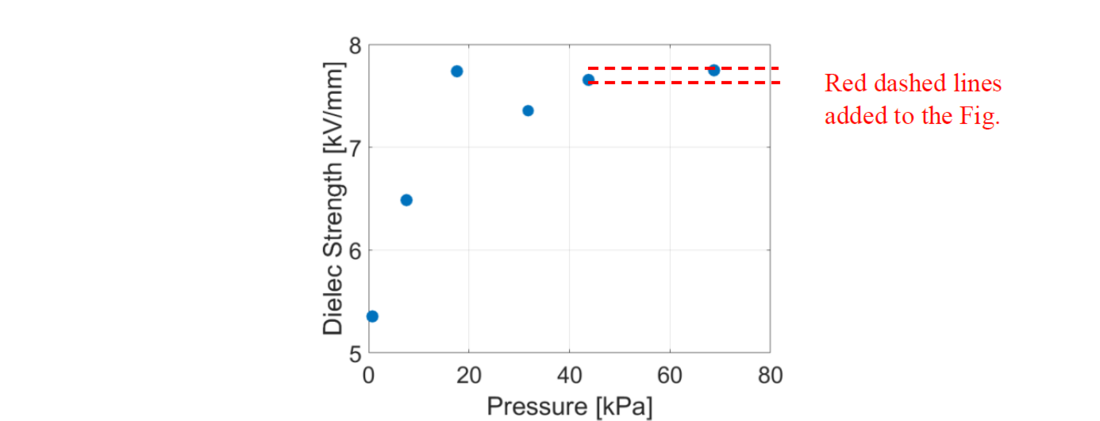
Figure 9 – Dielectric strength vs. interfacial pressure, with silicone grease [1]
Moreover, interface pressure measurements along the interface between a 525 kV HVDC cable and a related JDC joint have been performed. A section of the result from those measurements is depicted in Figure 10. The conclusion of those measurements is that pressure variation along the interface (approximately 100 kPa) is larger than the expected simulated impact on the interface pressure from a 10 m distant blasting (approximately 18 kPa). Therefore, the variation is covered by the design pressure in the interface, which is chosen to cope with a higher interface pressure variation throughout the interface.

Figure 10 – Green line represents a pressure measurement of the interface pressure towards the cable in a JDC 525 kV joint installed on a 525 kV HVDC cable. The scale of 100 kPa is represented in the figure. The x-axis gives a length scale in cm
3.2.1. Pressure change inside the ferrule
Due to the stiffness of the involved materials of the connector, pressure changes occur inside the ferrule. The resulting interface pressure change inside the connector is less than 50 kPa. Usual contact pressures are in the range of a MPa, i.e., at least a factor of 20 higher and therefore far above the observed impact.
3.2.2. Loads of screen wires
The maximum axial load at the screen wires is shown in Figure 11. The largest tensile force at the screen wires was approximately 12,7 N, whereas the largest compressive force was 11,6 N. Note that the allowable value for the screen wires is 440 N, based on the yield strength of the material. Hence the predicted loads on screen wires are well within the allowable limit.
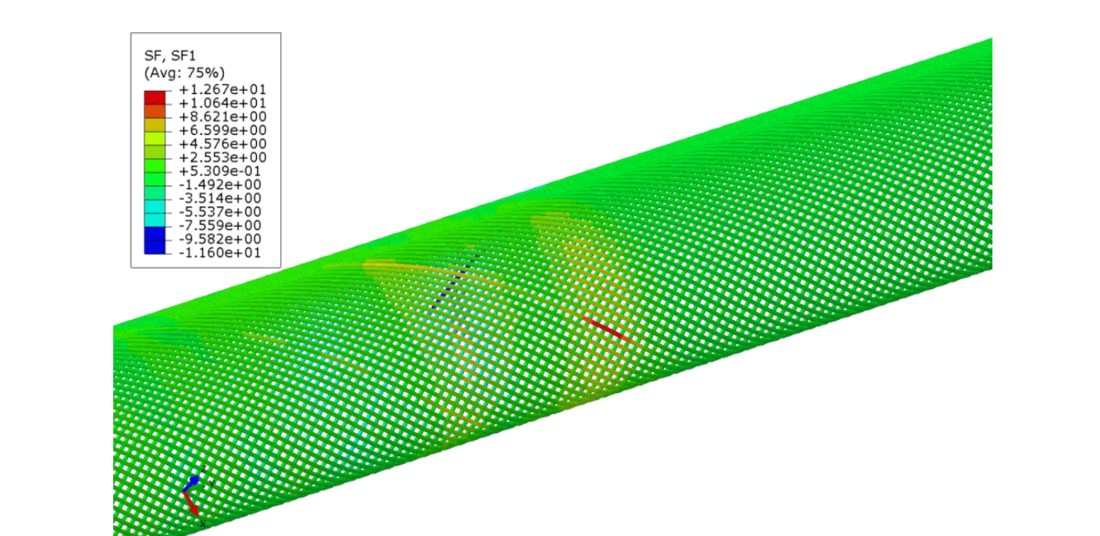
Figure 11 – Maximum axial loads at screen wires [N]
4. Conclusions
The deformations and the contact pressure changes generated by salt mining blast events on the 525 kV HVDC land cable including a cable joint of a prefabricated type were computed by means of finite element (FE) simulation. Moreover, the impact on the electrical performance was estimated, by considering potential impact on electrical field enhancement as well as electrical withstand. Commercial software suites were used for the FE analysis and for the evaluation of electric field distribution. The land cables connected by a metallic connector and a rubber joint were assumed to be surrounded by salt, sand, or stones. A blasting acceleration signal measured at 10 meters from the explosions with the peak value of 1210,5 m/s2 and duration of 0,8 ms was applied onto the land cables and the joint system.
From the detailed assessment of the most critical case of a 10 m distance blast, it can be concluded that: (a) the electrode deformation which might lead to local field enhancement has been calculated to be within the manufacturing tolerances and calculated fields vary in the range of numerical uncertainties. (b) The influence of the interface breakdown strength by contact pressure variations has been found to be within potential variations of the voltage application margins of standardized impulse tests, as well as being covered by design within the expected practical interface pressure variations. (c) Forces on the conductor connection within the ferrule are estimated to be far below the usual contact pressure. (d) The corresponding axial loads on the screen wires induced has been found less than 5% of the yield strength of the material.
Therefore, simulation results have shown that the overall deformations of the cable and joint system are relatively small and will have no major impact on the mechanical and electrical performance of the HVDC cable-joint system.
References
- D. Fournier, L. Lamare, Effect of Pressure and Length on Interfacial Breakdown between two Dielectric Surfaces. IEEE International Symposium on Electrical Insulation, Baltimore, MD USA, June 7-10, 1992.
- Electrothermal FEM simulation of relevant test conditions of a 525 kV HVDC cable joint including nonlinear field grading material, R. Hussain and C. Andersson, Jicable 2023, Lyon.