C2 - Advancing Forecast Technique for Photovoltaic Power Generation in Kansai Area under Snow Conditions
Authors
Shiho NAKATA, Takayuki YOSHIDA, Shota MIYAKE, Masaaki SAWASAKI - Kansai Transmission & Distribution, Inc., Japan
Nozomu TAKADA, Naoki INABA - Meteorological Engineering Center, Inc., Japan

Summary
In Kansai area, the introduction of PV has progressed. In March 2016, we developed Apollon (Areal solar POwer forecasting system using sateLLite imagery estimatiON), a short-time solar radiation forecasting system, and introduced a PV power estimation and forecasting system to the Central Load Dispatch Center to use this system for supply and demand operations.
In recent years, many damages due to abnormal weather have occurred in Japan. From late January to early February 2018, record cold was observed, and the supply and demand situation became severe for more than a week in Tokyo area. One of the factors behind the continued severe supply-demand situation is that snow melting did not proceed due to the low temperature tendency after the snow cover of 20 cm or more was recorded, and PV power could not be obtained more than expected.
If the effect of snow on PV is not considered, the predicted value of PV power generation is likely to be largely deviated, and if the effect of snow melting is not considered, the prediction of the restoration state of PV power generation is impossible. Since a similar event occurrence risk is assumed in Kansai area from recent weather conditions, this time, we tackled the improvement of a prediction method of Apollon considering snow cover. The improved method has already been introduced to the actual operation, and the reduction of forecast error could be confirmed on the day when snow was accumulated over a wide area in Kansai area due to the effect of the big cold wave. Therefore, this paper presents the outline of the developed snow coverage consideration method and the verification results in the actual operation.
Keywords
Photovoltaic Power Generation, Penetration, Satellite Image, Snow Cover, Solar Radiation1. Introduction
Photovoltaic power generation (PV) has been introduced as the world's largest renewable energy with the capacity per unit of national land area being the largest in the world. The Sixth Strategic Energy Plan was formulated in October 2021 to show the fundamental direction of energy policy aiming at realization of carbon neutrality by 2050 and greenhouse gas emission reduction targets in FY2030. In this plan, in FY2030, the target for the introduction of renewable energy is 36-38% of the total electric power consumption. At present, with S+3E, the principle of energy policies as a major premise, we are in the process of promoting the introduction and expansion of renewable energy sources while ensuring stable supplies throughout the entire power system. It is assumed that PV introduction volume will continue to increase in the future.
In the electric power system, it is operated so as to always balance the electric power demand and the electric power supply which change from moment to moment and to keep the frequency constant. Fluctuating renewable energy, which is highly dependent on the weather, such as PV and wind power generation, is distributed over a wide area and connected in large quantities. However, in order to operate the supply and demand, it is necessary to grasp the output fluctuation of fluctuating renewable energy in the whole area in advance, so that high-precision output forecasting for a wide area becomes important.
In Kansai area, large-scale introduction of PV was promoted among variable renewable energy. Under these circumstances, PV power estimation and forecasting of several hours ahead were required to properly operate the supply and demand. We developed Apollon (Areal solar POwer forecasting system using sateLLite imagery estimatiON), a short-term solar radiation forecasting system using satellite-based images, and introduced a PV power estimation and forecasting system to the Central Load Dispatch Center in March 2016 to use this system for supply and demand operations.
PV power forecasts are calculated by multiplying solar radiation forecasts by installed capacity and conversion coefficient, and efforts are continually being made to improve the accuracy of solar radiation forecasts and refine conversion coefficient [1], [2], [3]. On the other hand, the reduction of PV power due to snow cover has not been considered. Kansai area is a warm climate, and it is rare that snow accumulates in the whole area, but on the Sea of Japan side, snow accumulates under the influence of cold air from the north mainly in winter. In addition, when strong cold waves arrive once every few years, snow may accumulate over a wide area. In addition, in January 2018, the decline in PV power due to snow cover in other Japanese areas worsened the demand and supply of electricity due to the cold wave, making it a social issue. Against this background, Kansai area was also required to reduce the error in predicting PV power during snow cover.
In FY2019-2021, we conducted a study on a PV power forecasting method considering snow cover and snow melting, and developed two methods. Since the lead time of each method was different from that of each other, a prediction method that can utilize the advantages of each method by combining the two methods according to the lead time was developed, and it was reflected in the actual operation from December 2022. And, in January 2023, a large cold wave hit in Kansai area, and it became a snow cover in the wide area. The effectiveness of the development method in reducing the prediction error was confirmed from the actual operation data, and the accuracy verification results are reported.
2. PVS in Kansai Area and the overview of PV estimation / prediction methods
2.1. PVs in Kansai area
Fig. 1 shows the change in the installment capacity of variable renewable energy in Kansai area. Although the installed capacity of wind power is not large because of limited availability of the suitable lands, PV is steadily increasing, and the installed capacity as of March 2023 reached 7,000 MW. In the light-load period, PV occupies about 40% of the total demand in the Kansai area.
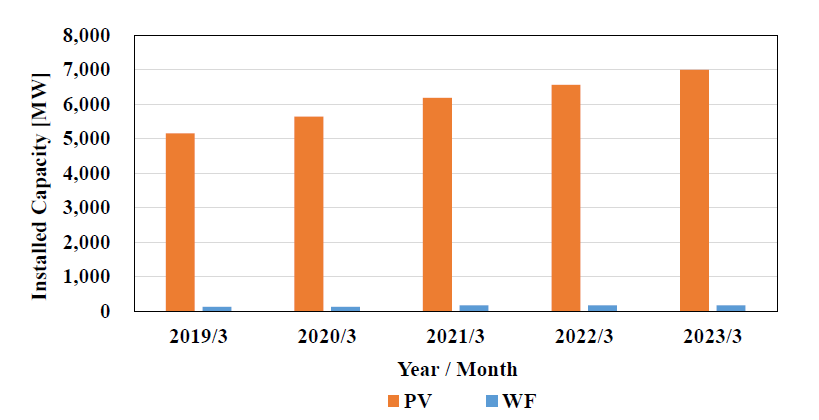
Figure 1 - The Change in Installed Capacity of Variable Renewable Energy in Kansai Area
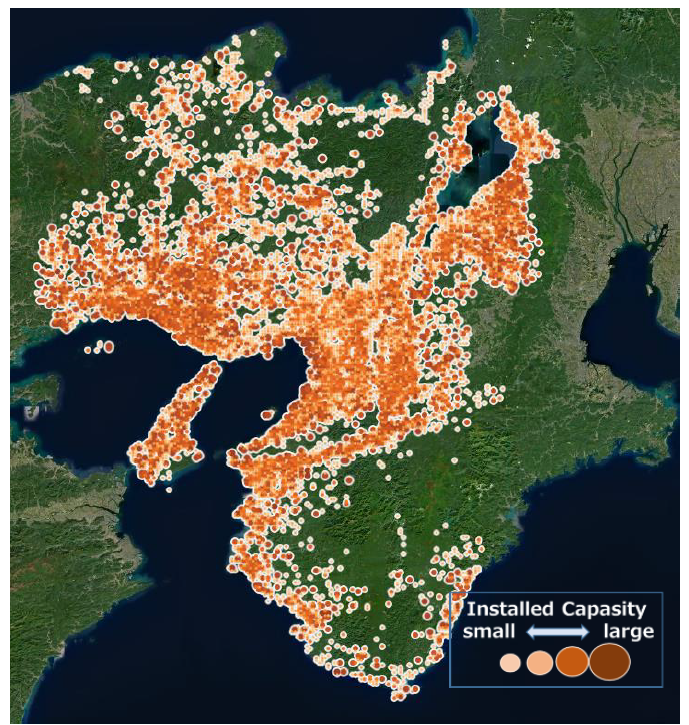
Figure 2 - PV Capacity Distribution in Kansai Area
Fig. 2 shows the distribution of PV equipment in Kansai area. In particular, the equipment is
densely distributed along the coast of Kansai metropolitan area and Osaka Bay, but PV facilities are distributed over a wide area throughout the plain area in Kansai area, and it can be confirmed that the facilities are also installed in the northern area where snow accumulates frequently in winter.
2.2. The Importance of Estimating/ Predicting of PV Power Output
In order to maintain the balance between supply and demand, it is required to change the supplying power and the adjusting power other than PV against the fluctuation of PV power. Supply and coordination capabilities require procurement of required quantities based on prior information for supply and demand operations. For stable and economical supply and demand operations, PV power needs to be predicted with high accuracy. In order to realize appropriate supply-demand operation and reduction of coordinating power costs, we are working to improve the accuracy of PV power forecasting in each time frame of output estimation to grasp the actual results of PV output, short-time destination forecast to several hours ahead used in economic load-dispatching control, and long-time destination forecast to the next day used to formulate a supplydemand operation plan and procure coordinating power. The prediction techniques for PV power differ in areas where there are several specialties [4]. Therefore, the prediction methods are selected according to the application. Output estimation and short-time-ahead prediction are mainly predicted using satellite image data as described in Chapter 1. On the other hand, for long-time-ahead prediction, prediction using a numerical forecast model is adopted. This paper introduces the snow coverage considerations in the output estimation and short-time-ahead prediction.
2.3. The Overview of PV Estimation and Short-Time Forecasting Methods in APOLLON
We introduce Apollon, a short-term solar radiation forecasting system, and a PV power forecasting and forecasting system to the Central Load Dispatch Center, and utilize this system in supply and demand operations. The outline of the present system is introduced. Apollon is a prediction method that synthesizes a prediction method using satellite-based images and a prediction method using Local Forecast Model (LFM), and is a system for estimating and predicting solar radiation up to three hours and thirty minutes ahead. Fig. 3 shows the outline of Apollon and the estimation and forecasting method of PV power. The prediction method using satellite images estimates and predicts solar radiation using satellite images continuously delivered from the weather satellite "Himawari" at intervals of 2.5 minutes.
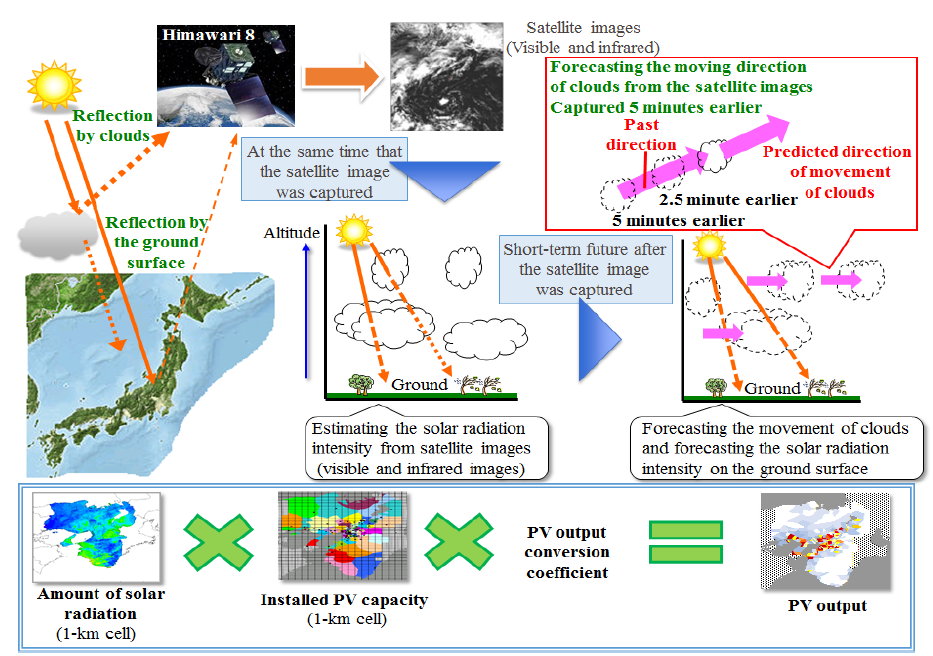
Figure 3 - Outline of Apollon and PV Output Estimation / Prediction Method
First, the characteristics of clouds are grasped using visible and infrared images distributed from meteorological satellites, and the solar radiation intensity of the ground surface at the shooting time of satellite images is estimated from the distribution of clouds. Generally, the accuracy of visible images is low in the time zone where there is no visible light before dawn. Therefore, in order to estimate the distribution of clouds accurately even in the early morning, early morning judgments are carried out for each mesh using the theoretical solar radiation on fine weather, and for the mesh judged to be early morning, the distribution of clouds is estimated from infrared images, water vapor images, and air temperature above that can be used even before dawn. For other meshes, the distribution of clouds is estimated from visible images.Next, the movement vector of the cloud is estimated by applying pattern matching, which is a technique to examine the similarity of figures, to successive multiple satellite images, and the solar radiation intensity of the ground surface is predicted by predicting the cloud distribution ahead of the shooting time of the satellite images. At this time, the pattern matching is applied to the cloud distribution estimated from only visible images and the cloud distribution estimated from infrared images, etc., respectively, for all meshes. Then, early morning judgment is carried out using theoretical solar radiation on fine weather for every application range of the pattern matching, and the movement vector of cloud is adopted in visible images if it is not early morning, or in infrated images if it is early morning.The prediction method using LFM estimates and predicts the solar radiation by converting LFM cloud amount data with the original model. LFM is a weather forecast method that calculates the change in atmospheric conditions numerically to predict future conditions. It is meteorological data delivered from the Japan Meteorological Agency (JMA) every time. Compared with the method using satellite-based images, the prediction method using LFM is not expected to have higher accuracy than the method using satellite-based images. However, it is advantageous in that the accuracy is hardly reduced even if the prediction time becomes longer.
The amount of solar radiation is calculated using the synthesis coefficient that gives the best accuracy in the synthesis method of the two methods. These formulae can be written as follows:
(1)
where ????? is the amount of solar radiation by Apollon, c is the synthesis coefficient, ????? is the amount of solar radiation by sattellite images, and ????? is the amount of solar radiation by LFM.
Since PV is distributed over a wide area and the amount of solar radiation varies depending on the site, PV power in the whole Kansai area is estimated and predicted by multiplying the amount of solar radiation in 1 km mesh units obtained by Apollon, the amount of PV introduction of each mesh, and the conversion coefficient, considering the geographical distribution.
The conversion coefficient varies depending on the installation angle of the PV solar panel and the efficiency of the PV inverter. In addition, real time PV power in Kansai area is available only from some facilities such as extra-high-voltage interconnection. On the other hand, the installation of smart meters has been completed in the whole Kansai area, and the accumulated PV power in Kansai area is available from smart meters. Therefore, the conversion coefficient is optimized to minimize PV power estimation error by using the smart meter data. Specifically, the measured data obtained from smart meters every 30 minutes are used as the reference values. Then the PV output is estimated using the Apollon solar radiation. The estimated error of the PV output is calculated comparing those two data obtained at the same time. The method searches for the conversion coefficient which minimizes the estimated error in the whole Kansai area and treats the derived conversion coefficient as the optimal conversion coefficient.
3. The PV estimation / predictionmethod under snow conditions
In order to manage a stable and economical supply/demand operation in a power system in which PVs are connected in large quantities, it is crucial to accurately estimate the outputs from PV generation. However, when they are covered with snow, it prevents sunlight from reaching the panels resulting in reduced PV output. The current prediction method does not take into account the effects of snow cover, which leads to over estimation of the power output. Therefore, if there is snow over a wide area, the current method will not be able to accommodate the reduction in power generation due to snow cover and melting, which may interfere with stable power supply. To reduce such errors, it is important to take into account the effect of snow in estimating PV power output.
The effect of snowfall on PV output estimation was investigated both in Japanese and overseas [5], [6]. For example, Bill et al. (2013) evaluated the cumulative loss of solar power generation due to snow cover during a winter season for a certain PV power generation facility. Our current need is to evaluate and predict the effect of snow on PV power up to several hours ahead in the whole Kansai area, so it is difficult to directly apply the method of the previous study. However, if the cumulative loss for the whole Kansai area can be predicted appropriately, it will satisfy our needs. Given the above background, we developed a PV forecast method which takes into account the effect of snow cover.
In Apollon, the amount of solar radiation on the ground surface is predicted per 1 km mesh. However, in order to improve the accuracy for predicting PV power generation during snow cover, the amount of solar radiation on the PV panel themselves, instead of the ground surface, must be predicted. Thus, as a forecast technique of solar radiation which takes into account the effect of snow cover, this paper verified two different techniques; a solar radiation forecasting technique using snow depth and the satellite images, followed by a synthesis technique which combines the two.
3.1. Snow Depth Method : Prediction Method of Solar Radiation Using Snow Depth Data
Fig. 4 shows the method for predicting solar radiation using the developed snow depth data. In this technique, the relationship between snow depth and PV power generation ratio by snow cover (power generation output when there is snow cover/power generation output when there is no snow cover) is obtained from the past data, and the temporal change of snow depth is predicted using a part of snow melting model (a technique developed to calculate river flow rate and dam inflow, etc. considering snow cover and snow melting process) from the latest meteorological data. Then, the amount of solar radiation considering snow cover is calculated from the ratio of PV power generation according to the depth of snow cover and the amount of solar radiation not considering snow cover. It is an effective technique for the prediction of several hours ahead, because it is a technique to predict the time change by modelling the physical process of snowmelt. Details of the method are described below.
The snow melting model can be calculated continuously throughout the snow and snow melting season, and in the calculation process, various elements expressing snow conditions such as snow water quantity, snow depth, snow density, snow temperature, and water content are calculated. The snow depth is calculated by inputting Meso-Scale Model (MSM) data of JMA. MSM is a numerical forecast model based on the non-hydrostatic model. In order to make the calculation error of snow depth as small as possible, the correction by the ground observation snow depth data is also carried out.
The correction based on the ground observation snow depth data is as follows. The ratio of the snow depth data observed by Automatic Weather Stations (AWSs) to the snow depth data of the mesh just above each observation point (1 km mesh) of the snow melting model is calculated for each point. The depth of snow is corrected more accurately by multiplying the calculated depth of snow by the correction coefficient distribution obtained by interpolating the calculated correction coefficient for each point into 1 km mesh.
PV power generation ratio is calculated by inserting corrected snow depth data as inputs using an attenuation rate model. The attenuation rate model is a model created from the analysis result of the relationship between the Apollon power generation amount and the actual power generation amount before correction for each value of snow depth.
Then, the amount of solar radiation in consideration of snow is calculated by multiplying the calculated ratio of PV power generation and the amount of solar radiation in which snow cover is not considered. These formulae can be written as follows:
(2)
where ??? is the amount of solar radiation in consideration of snow, ??0 is the amount of solar radiation in no consideration of snow and K is the PV power generation ratio by Snow Depth Method.
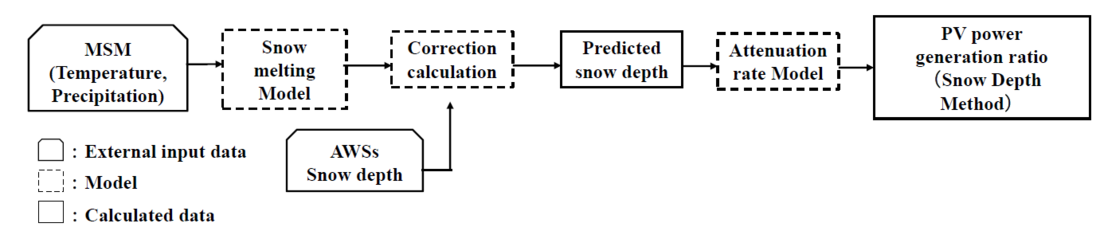
Figure 4 - Snow Depth Method
3.2. Snow Albedo Method : Prediction Method of Solar Radiation Using Snow Cover Determination by Satellite Images
Fig. 5 shows a method for predicting solar radiation using snow cover data derived from the satellite images. In this method, the relationship between snow albedo (light reflectance obtained from satellite images, which is defined to be reflected by snow) and PV power generation ratio is obtained from the historical data, and the temporal change of snow albedo is predicted using data from a meteorological satellite called Himawari. The satellite emits data every 2.5 minutes, and it has Himawari has spatial resolution of 0.5 and 2 km for visible and infrared band respectively. Therefore, the consideration of snow cover change in real time can be realized. Since the physical process of snowmelt is not considered, the accuracy decreases when the prediction time becomes long, but the accuracy improvement of the latest prediction can be expected, because the satellite image data is utilized.
For the estimation of snow albedo, analytical snow depth data and cloud albedo are utilized. The analytical snow depth data is the present estimate data of the snow depth profile of 5 km meshes delivered from JMA. The distribution began from 21st November 2019. The snow albedo is estimated from the result of judging whether snow accumulates on each mesh by the analysis snow depth data and the minimum value of the cloud albedo for the past 30 minutes. For the estimated snow albedo, the prediction of snow albedo in a short time ahead is carried out by extrapolating the change tendency of snow albedo in the past 60 minutes.
Then, the amount of solar radiation considering snow cover is calculated from the ratio of PV power generation according to snow albedo and the amount of solar radiation not considering snow cover. These formulae can be written as follows:
(3)
(4)
where T is the PV power generation ratio by Snow Albedo Method, ???? is the maximum solar reduction rate, ???? is the predicted snow albedo, ???? is the upper limit of snow albedo, and ??? is the amount of solar radiation in consideration of snow.
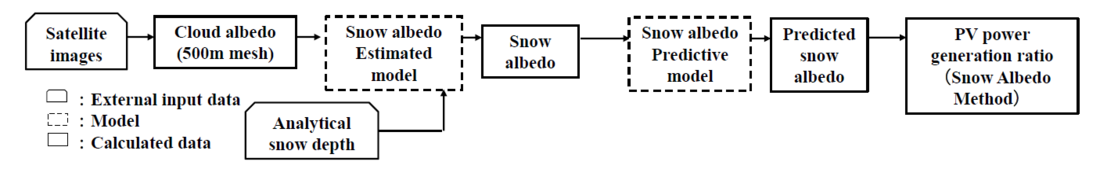
Figure 5 - Snow Albedo Method
3.3. Synthesis Technique
Since "snow depth technique" and "snow albedo technique" have different errors according to lead times, a technique for synthesizing each solar radiation quantity by a ratio according to forecast time was developed as a solar radiation forecast processing considering the final snow cover. The composition ratio is obtained in advance by using the least squares method based on the error data of each method with respect to the forecast time. The predicted value by the synthesis method is calculated from the predicted value and the ratio of each method. These formulae can be written as follows:
(5)
where ????? is the amount of solar radiation by Combined Method, and r is the combined ratio.
3.4. Validation of the PV Predictive Accuracy
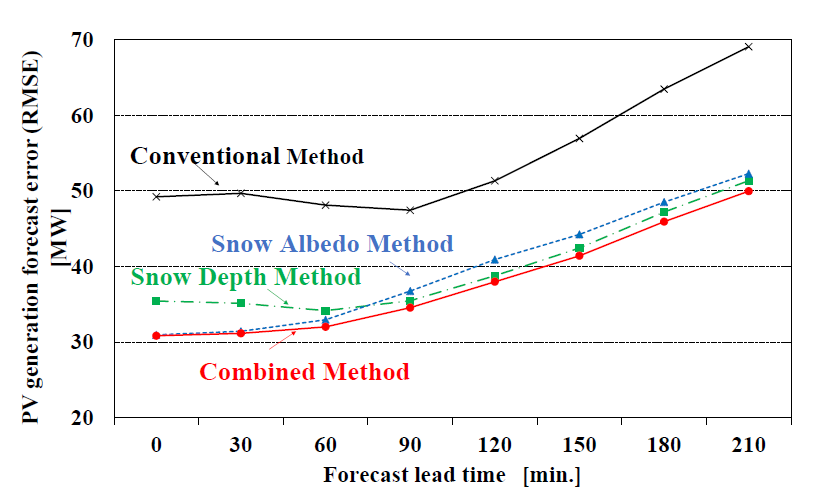
Figure 6 - PV power forecast error
Fig. 6 shows the relation between PV power forecast error and forecast time by applying the method. Using the data for winter from FY2017 to FY2020, we estimated the total PV output of only the mesh with snow.
As a result, we found that the application of a synthesis method which uses the optimal synthesis ratio according to each forecast time can reduce the error by 26-37% compared to the previous method.
when the prediction is short, the accuracy is better for the "snow albedo technique" which can reflect the latest weather situation because the acquisition cycle of satellite image data is short, and when the prediction time is long, the accuracy is better for the "snow depth technique". And, it was able to be confirmed that the accuracy was further improved than each by synthesizing these techniques.
4. The result for implementation in power system operation
Considering the effect of snow cover, it was confirmed that the prediction accuracy of PV power generation was improved. Therefore, since December 2022, the synthetic method has been reflected in the solar radiation prediction process by Apollon, and its utilization in practical work has been started.
In Kansai area, snow coverage is observed mainly along the coast in the northern Kansai area, but almost no snow coverage is observed in the southward direction. From the afternoon of January 24th to 25th in 2023, heavy snowfall occurred in the northern Kansai area and mountainous areas mainly due to the effect of the great cold wave in Kansai area. Urban areas, for example, were covered up to 2 cm of snow for the first time in 15 years.
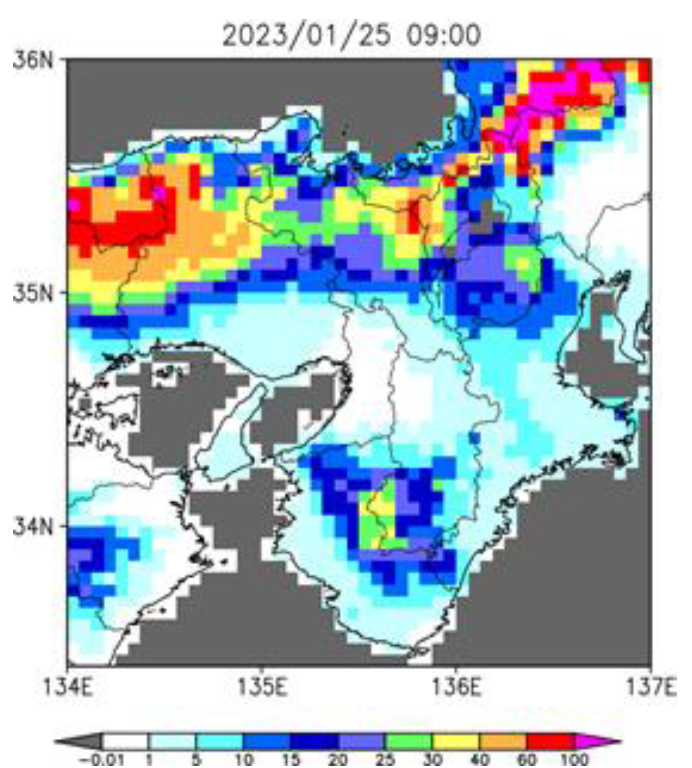
Figure 7 - Snow distribution in Kansai area
Transportation facilities were planned to be suspended and trains were stalled. As a result, the snowfall became so heavy that it caused a big impact on society. As a verification of the effectiveness of the synthetic method in actual operation, the results of verification on 25th January 2023, when the effect of snow cover was largely observed, are shown below.
4.1. Weather Conditions
The weather conditions at the date and time to be verified at this time are explained. From January 24th to 25th in 2023, it became a heavy snow mainly on the Sea of Japan side and mountains because of the strong winter-type pressure arrangement. In particular, from the afternoon of 24th to the morning of 25th, snow clouds flowed in one after another from the Sea of Japan and Osaka Bay due to the effects of strong northerly winds and the inflow of strong cold air of -12 ℃ or less in 850 hPa (about 1.5 km altitude).
Fig. 7 shows the distribution of snow at 9:00 on 25th January 2023, which is the subject of the current verification. It can be seen that due to the influence of snow clouds, heavy snow was found over a wide area in Kansai area, including the plain area where it rarely snow. On the 24th, the weather in Osaka was cloudy with temporal sun in the morning, and it was cloudy with occasional snow after the sun in the afternoon. In the morning of the 25th, it was cloudy followed by the sun with occasional snows, and it was clear in the afternoon. In the 25th, there was solar radiation in the situation where the snow remained, so the effect of the proposed method was expected.
4.2. The Results for the Validation Analysis
To verify the validity of our new method upon practical implementation, they were verified for each of the three conditions; the whole area, the area with snow cover, and the area without snow cover.
4.2.1. The Results for the whole Kansai area
The section takes you through the results of verification for the Kansai area. Fig. 8 shows the total PV power in the whole area over the course of the forecast times. Fig. 9 shows the relationship between RMSE of PV power outputs and times. By applying the synthesis technique, the prediction accuracy was improved at any timepoints, and the error were reduced by 43-64%.
(1) Estimation Results of Current Status Values (2) 210 Minutes Prediction Results
Figure 8 - Total PV power in all meshes in Kansai area
In general, the longer the lead time, the larger the prediction error. In Fig. 9, the longer the lead time, the smaller the prediction error. The factors behind this event are inferred as follows.
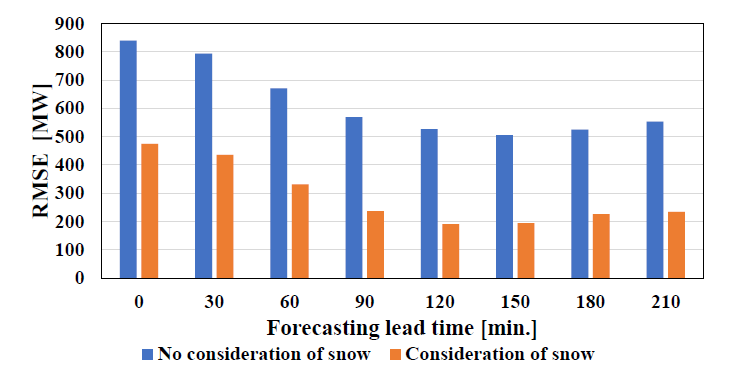
Figure 9 - PV Power Forecast Error for All Meshes in Kansai Area
Although Apollon grasps the distribution of clouds from satellite images and estimates the movement vector of clouds in a short time ahead, the advection prediction of clouds was deviated in the present verification object date and time, and clouds were predicted to flow into the plain area more than in the actual case. The larger the lead time, the smaller the amount of solar radiation was predicted due to the forecast that there would be clouds despite the sunny weather, but the forecast error was considered to be smaller as a result of the forecast in the same direction as the power generation loss due to snow accumulation. Since this is not an effect of the introduction method, the reference to this event is left to this point.
4.2.2. The Results for the Area with Snow
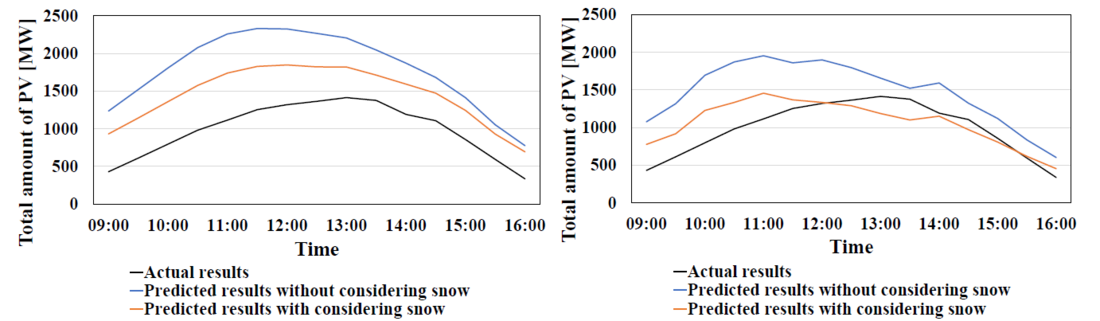
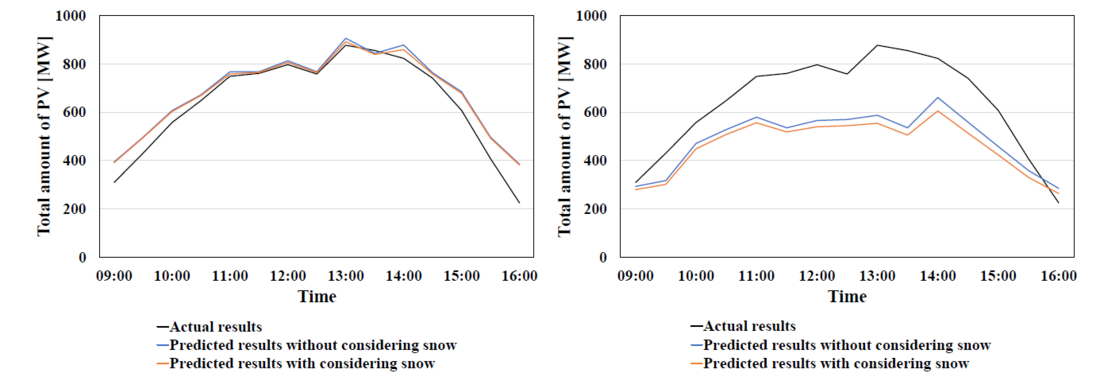
It is verified for the total PV power of only mesh-with snow. Fig. 10 shows the total PV power of the snowy mesh.
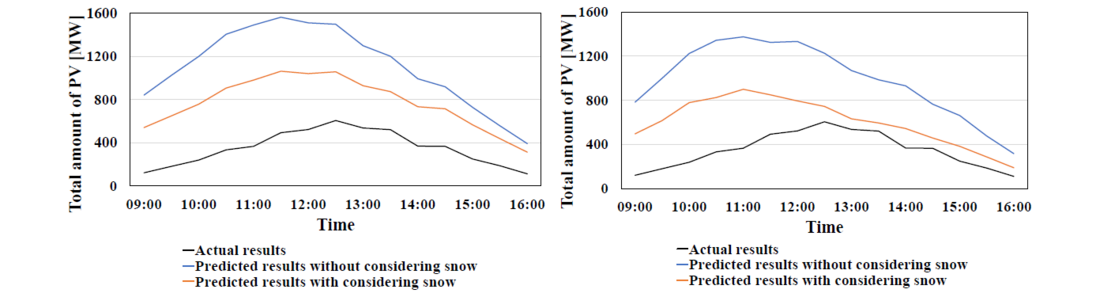
(1) Estimation Results of Current Status Values (2) 210 Minutes Prediction Results
Figure 10 - Total PV power with only snowy meshes
Fig. 11 shows the relation between PV power forecast error and forecast time. As shown in the figure, the prediction accuracy was improved in both prediction time sections by applying the synthesis technique, and an error reduction of 45-55% was confirmed.
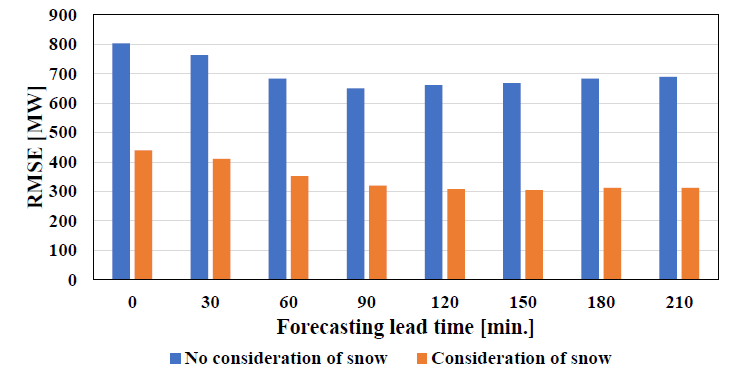
Figure 11 - PV Power Forecast Error with Snow-Covered Meshes Only
4.2.3. The Results for Area without Snow
It is verified for the total PV power of only meshes without snow cover. Fig. 12 shows the total PV power of only the mesh-type without snow accumulation, and Fig. 13 shows the relation between PV power forecast error and forecast time.
It was confirmed from the figure that the prediction accuracy was almost the same before and after the application of the synthesis technique, and that this technique applied to the mesh with the snow did not adversely affect the mesh without the snow.
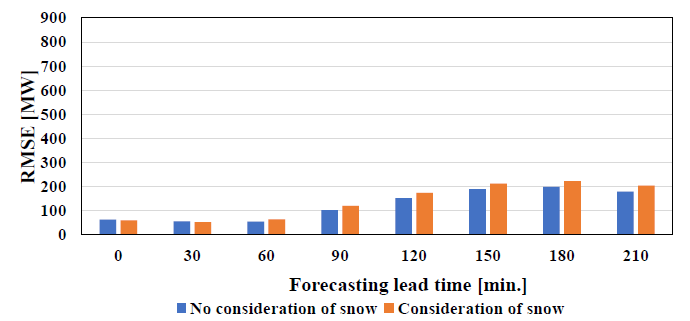
Figure 13 - PV power forecast error with only snow-free meshes
From the above, the prediction accuracy improvement by the introduction technique was observed only in the mesh with snow, and the change in the accuracy was not observed only in the mesh without snow almost before and after the introduction. As can be seen from PV installed capacity distribution in Fig. 2 and the snow coverage distribution in Fig. 7, it is considered that the effect of snow was large in the northern part of Kansai area and PV power was reduced. The effect of the introduction technique considering the snow coverage was able to be confirmed, because the prediction accuracy in the whole mesh was improved.
(1) Estimation Results of Current Status Values (2) 210 Minutes Prediction Results
Figure 12 - Total PV power with only snow-free meshes
4.3. Improvement for the Future Research
This time, in verification results in all meshes in Kansai area and verification results in only meshes with snow, improvement in prediction accuracy was found by the introduction of this technique. However, in the case of only mesh with snow cover, the predicted value when snow cover was considered for the actual results was overestimated as much as the largest 400 MW. Concerning the factors of this event, the following are considered.
In this method, PV power generation ratio is used to calculate the Apollon predicted solar radiation considering snow cover. As described in Chapter 3, the attenuation rate model is a model created from the analysis results of past actual power generation for each value of snow depth. The attenuation rate model currently in use is a model prepared from the past results in a single year in 2020, and the maximum snow depth in Kansai area was about 20 cm in 2020. On the other hand, on 25th January 2023, a maximum snow cover of 31 cm was confirmed due to the effect of the great cold wave.
From the above, it is considered that the snow depth was large compared with the model preparation period at the target date and time of this verification, and as a result, the correction of the snow cover effect was insufficient.
It is considered that accuracy improvement can be attempted in future by accumulating snow cover data including cases in which snow depth is big, and by reexamining attenuation rate models. In addition, there are partials of the methodology that are determined based on historical data. At present, it is under examination that it should be optimally renewed as a whole prediction model considering the snow cover effect in the actual operation.
5. Conclusion
This paper proposes the PV power prediction method considering the effect of snow in Kansai area, and also demonstrated the improvement in the prediction accuracy when implemented in the actual operation. As a forecast technique of solar radiation which takes into account the effect of snow cover, this paper verified two different techniques; a solar radiation forecasting technique using snow depth and the satellite images, followed by a synthesis technique which combines the two. We verified the effectiveness of the synthesis method using actual data from a day with heavy snowfall. The results showed that the RMSE of PV power outputs was reduced by about half.
In the future, PVs are expected to further expand in the whole Kansai area with the current movement toward the further penetration of the renewable energy. In order to achieve the safe and stable supply in the system in where the large quantity of the renewable energy is connected. With the aim of achieving more stable and economical supply-demand operations, we will continue to work on improving the accuracy of renewable energy forecasts.
References
- T.Kawakami, K.Takeuchi, S.Miyake, S.Uchiyama, T.Tsuruoka and N.Takada “Improvement in Estimation Accuracy for Current and Short-Term Future Photovoltaic Generation Output through Big Data Analysis Using Smart Meters” (CIGRE 2018 Session, ref. C2-210_2018)
- M.Sawasaki and N.Takada “Study on Improvement in Estimation Accuracy for Short-Term Future Photovoltaic Generation” (IEEJ 2020 Session, No.6-232) (in Japanese)
- O.Yatsubo, S.Miyake, N.Takada “Technologies for estimation and forecasting of photovoltaic generation output supporting stable operation of electric power system” (IEEJ TRANSACTIONS ON ELECTRICAL AND ELECTRONIC ENGINEERING IEEJ Trans 2018; 13: 350-355 Published online in Wiley Online Library (online). DOI:10.1002/tee.22585)
- K.Yoshimoto “Review : Power system supply and demand operations and renewable energy output forecasting” (IEEJ Vol.143 No.5, May 2023, pages 256-258) (in Japanese)
- A.Hashimoto and T.Kobayashi “Effects of Short-wave Albedo of Snow on the Estimate of the Solar Irradiance from the Geostationary Satellite Himawari-8 (part 2) ” (Proceedings of JSES Conference, October 2019, pages 67-70) (in Japanese)
- Bill Marion, Robert Schaefer, Holden Caine, Gonzalo Sanchez. “Measured and modeled photovoltaic system energy losses from snow for Colorado and Wisconsin Locations” (Solar Energy Vol.97, November 2013, pages 112-121)